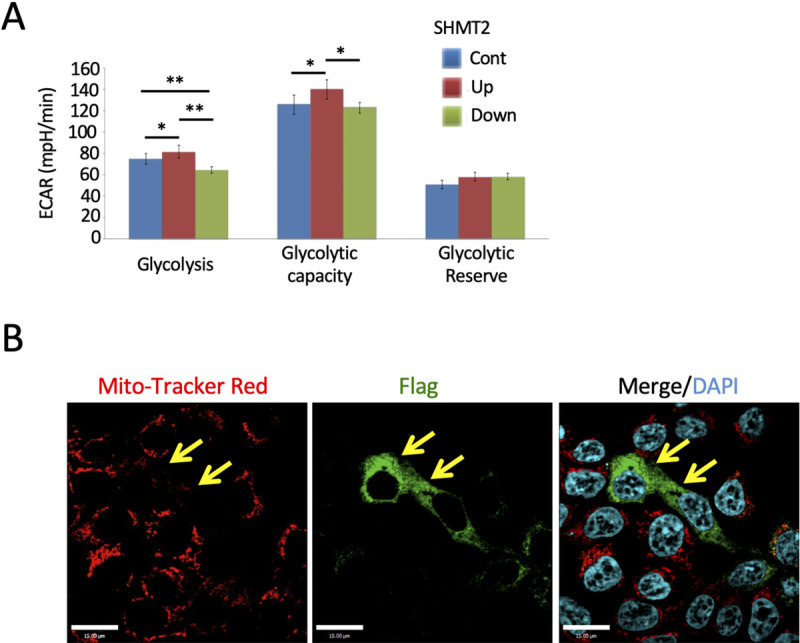
Fig 6. Changes of SHMT2 expressions affected glycolysis and reduced capacity of mitochondria in HeLa-Ss cells.

(A) Seahorse XFe96 Extracellular Flux analyzer was used to measure extracellular acidification rate (ECAR) as an indicator of glycolysis. Basal, maximum and reserved ECAR rate among control, SHMT2 over-expression and knockdown HeLa-Ss cells was compared. All data are presented as mean ± SD from 3 independent experiments with 6–14 replicate wells per experiment. * p < 0.05 and ** p < 0.001 (Student T-test). (B) Reduced MitoTracker Red level in SHMT2 over-expressing cells. Forty-eight hours after transfection with the SHMT2-Flag vector, HeLa cells were incubated with MitoTracker Red and fixed and stained with anti-Flag antibodies (green). Yellow arrows indicate SHMT2-Flag-expressing cells. Scale bars are 15 μm.
