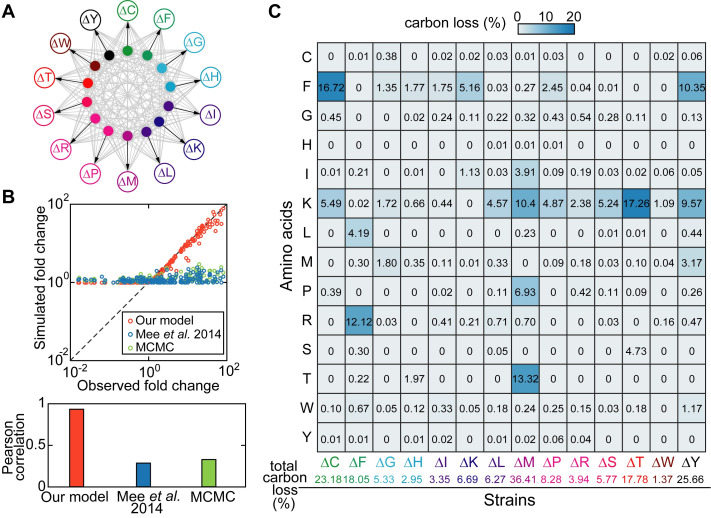
Fig 5. Modeling a consortium of 14 amino acid auxotrophies.
(A) Schematic diagram of the model. Each labeled empty circle represents one amino acid auxotroph and each filled circle with the same color corresponds to the amino acid that it is auxotrophic for. Gray arrows indicate production and release of amino acids to the environment and black arrows indicate the uptake of amino acids by their auxotrophies. (B) Scatter plot (upper panel) and Pearson correlation (bottom panel) between observed [22] and predicted cell density fold changes across all pairwise batch coculture of 14 E. coli amino acid auxotrophies. Orange circles: our model with manually curated parameters; Blue circles: a Lotka-Volterra-type model with parameters adopted from Mee et al. [22]; Green circles: the same Lotka-Volterra-type model with parameters optimized by Markov-Chain-Monte-Carlo (MCMC) algorithm. (C) Predicted amino acid leakage profiles (converted to percentage of carbon loss) for the 14 amino acid auxotrophies. Each value in the matrix describes the fraction of carbon loss due to release of the amino acid in the row by the auxotroph in the column. Abbreviations: cysteine auxotroph (ΔC), phenylalanine auxotroph (ΔF), glycine auxotroph (ΔG), histidine auxotroph (ΔH), isoleucine auxotroph (ΔI), lysine auxotroph (ΔK), leucine auxotroph (ΔL), methionine auxotroph (ΔM), proline auxotroph (ΔP), arginine auxotroph (ΔR), serine auxotroph (ΔS), threonine auxotroph (ΔT), tryptophan auxotroph (ΔW), and tyrosine auxotroph (ΔY).

