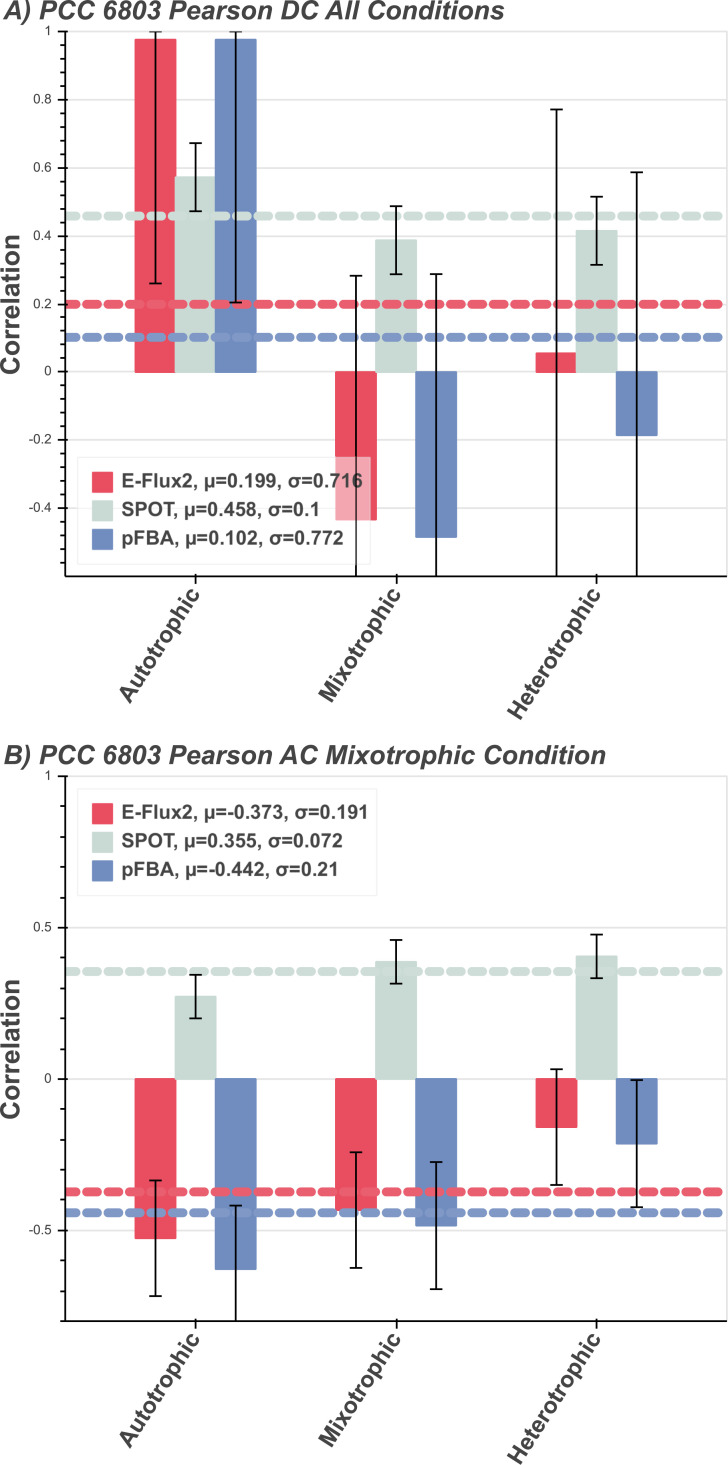
Fig 3. Synechocystis sp. PCC 6803 predictions.
Correlations between measured and predicted flux of multitrophic Synechocystis sp. PCC 6803 grown in 3 different environment conditions for the three FBA methods E-Flux2 (red), SPOT (gray), pFBA (blue). Horizontal dashed lines are the respectively colored mean μ, correlations per method. The mean (μ) is the average prediction correlation per method. The above and below the mean. A) Autotrophic, mixotrophic, and heterotrophic conditional constraints standard deviation (σ) is the spread of prediction correlation applied and correlated with respective measured fluxes, denoted by the error bars. pFBA was given the additional constraint of known uptake rate in the single carbon source, while E-Flux2 and SPOT were not. B) Mixotrophic condition constraints applied and correlated with all three conditional measured fluxes. See Section Methods for condition specific model constraints and see Supplementary S1 Table for uptake rates used. for uptake rates used.

