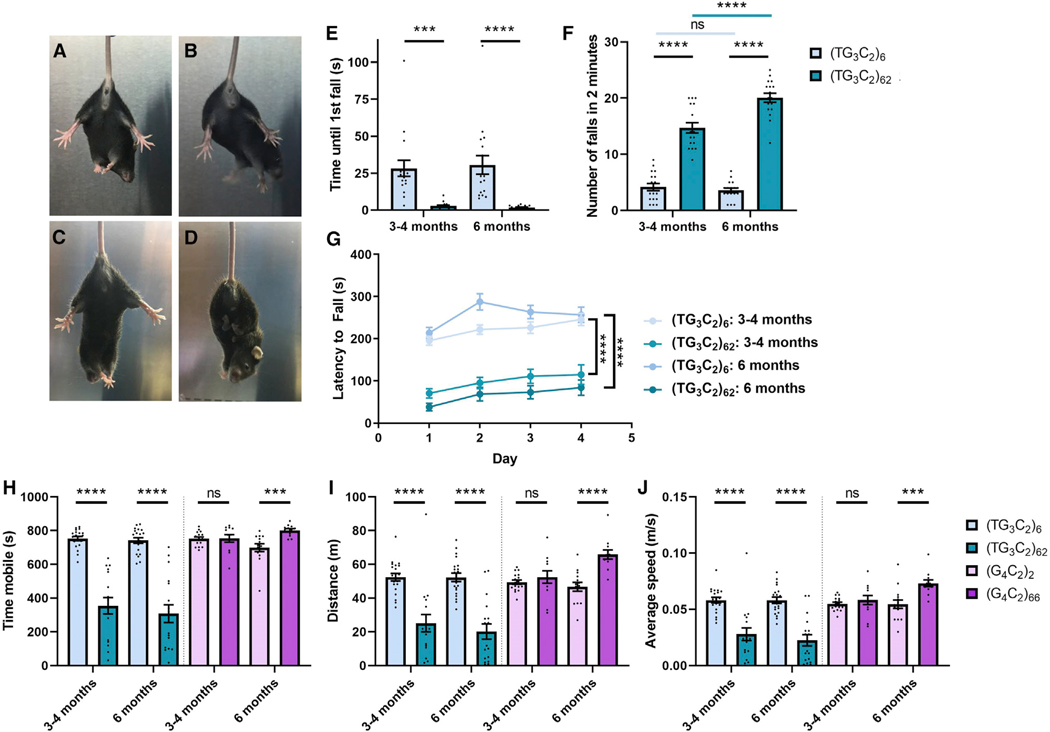
Figure 1. Mice Expressing Similar Repeat Expansions Show Distinct Behavioral Defects.
(A–D) Clasping phenotypes for (TG3C2)6 (A and C) and (TG3C2)62 (B and D) mice at 1 month (A and B) and 5 months (C and D).
(E and F) Hanging wire assay. (TG3C2)62 mice fall sooner (E) and more often (F) than their littermate controls.
(G) Rotating rod assay. The average latency to fall over 4 days is shown.
(H–J) The total time mobile (H), total distance covered (I), and average speed (J) in an open field assay.</p/>Error bars are SEM. 3- to 4-month-old mice: n = 20 (TG3C2)6; 17 (TG3C2)62; 17 (G4C2)2; 12 (G4C2)66. 6-month-old mice: n = 20 (TG3C2)6; 17 (TG3C2)62; 14 (G4C2)2; 12 (G4C2)66. ***p ≤ 0.001, ****p ≤ 0.0001; ns, non-significant (two-way ANOVA with Sidak’s multiple comparisons test). All graphs use the same color scheme.

