
Figure 2. Expression of (G4C2)66 Induces Cortical Neuronal Loss, whereas Expression of (TG3C2)62 Affects the Cerebellum.
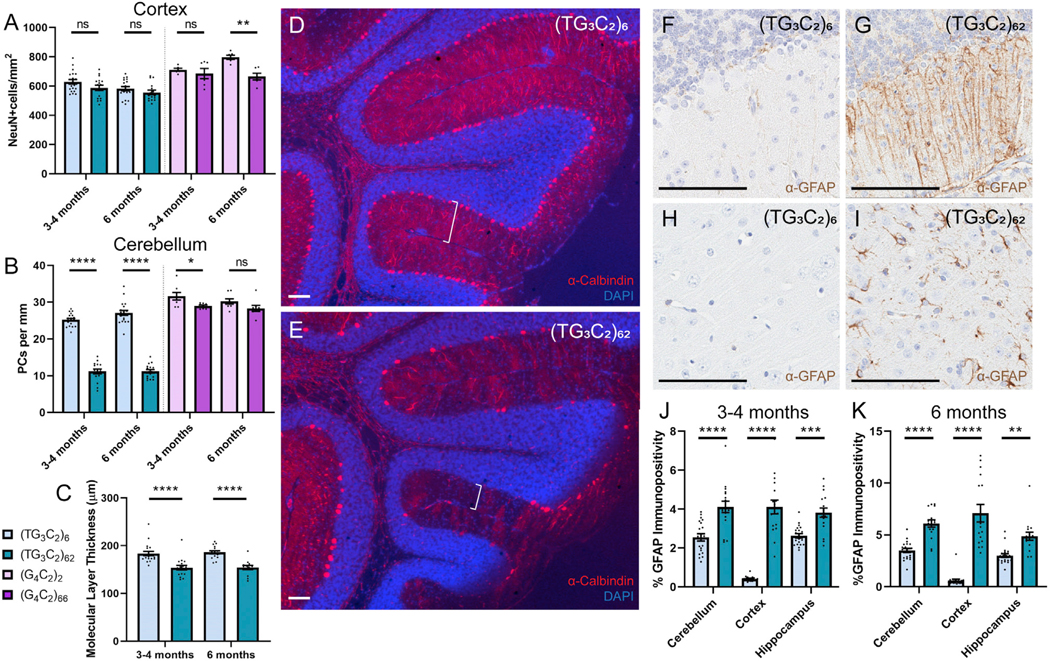
(A) The number of NeuN-positive cells per square millimeter in the cortex of the mice indicated.
(B) The number of Purkinje cells per millimeter in the cerebellum of the mice indicated.
(C) The average molecular layer thickness in micrometers for TG3C2 mice.
(D and E) Representative images of cerebellar degeneration from 3- to 4-month-old (TG3C2)62 mice (E) compared to (TG3C2)6 controls (D). Calbindin is shown in red; DAPI marks nuclei in blue. Brackets denote molecular layer thickness. Similar results were obtained at 6 months.
(F–K) IHC for GFAP in the cerebellum (F and G) and cortex (H and I) of representative 3- to 4-month-old mice. Similar results were obtained at 6 months.</p/>Quantification of GFAP positivity in TG3C2 mice at 3–4 months (J) and 6 months (K).
Error bars are SEM. Scale bars: 100 μm. 3- to 4-month-old mice: n = 20 (TG3C2)6; 17 (TG3C2)62; 17 (G4C2)2; 12 (G4C2)66. 6-month-old mice: n = 20 (TG3C2)6; 17 (TG3C2)62; 14 (G4C2)2; 12 (G4C2)66. *p ≤ 0.05, **p ≤ 0.01, ***p ≤ 0.001, ****p ≤ 0.0001. ns, non-significant (two-way ANOVA with Sidak’s multiple comparisons test).