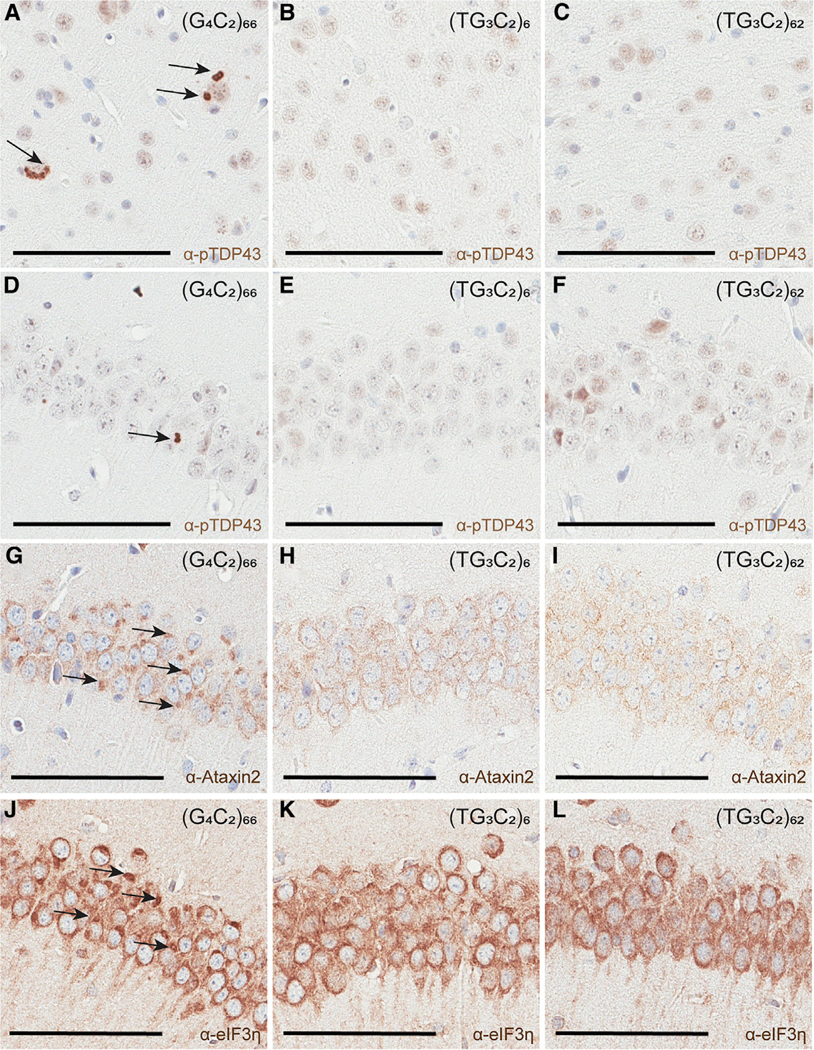
Figure 4. No pTDP-43 Inclusions or Aberrant Stress Granule Pathology in (TG3C2)62 Mice.

(A–F) IHC for pTDP-43 in the cortex (A–C) and hippocampus (D–F) of representative 12-month-old mice. Arrows mark inclusions.
(G–I) IHC for Ataxin2 reveals aberrant pathology (arrows) in the hippocampus of representative 12-month-old (G4C2)66 mice (G), but not in TG3C2 animals (H and I).
(J–L) IHC for eIF3h reveals aberrant pathology (arrows) in the hippocampus of representative 12-month-old (G4C2)66 mice (J), but not in TG3C2 animals (K and L).
Scale bars: 100 μm.
