
Figure 1.
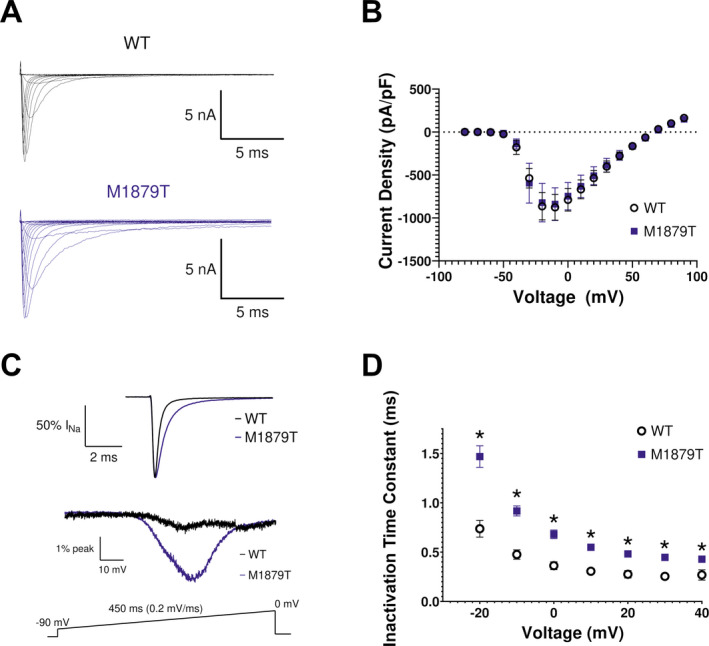
M1879T mutation alters NaV1.2 inactivation kinetics. (A) Representative current recordings from WT and M1879T NaV1.2 obtained using the voltage protocol shown in Figure 2A (inset). (B) Current density–voltage plot for WT (n = 18) and M1879T (n = 20) channels. (C) Top, average of six TTX‐subtracted recorded at 0 mV and normalized to peak current to highlight inactivation time‐course of WT (black) and M1879T (blue). Bottom, average currents for WT (black, average of 5) and M1879T (blue, average of 6) elicited using the voltage ramp protocol shown below. Traces were normalized to peak current measured at 0 mV. (D) Voltage dependence of inactivation time constants determined from single‐component exponential curve fits to the current decay. n = 14 for WT and n = 14 for M1879T, *P < 0.05 by Mann–Whitney U test.