Figure 7.

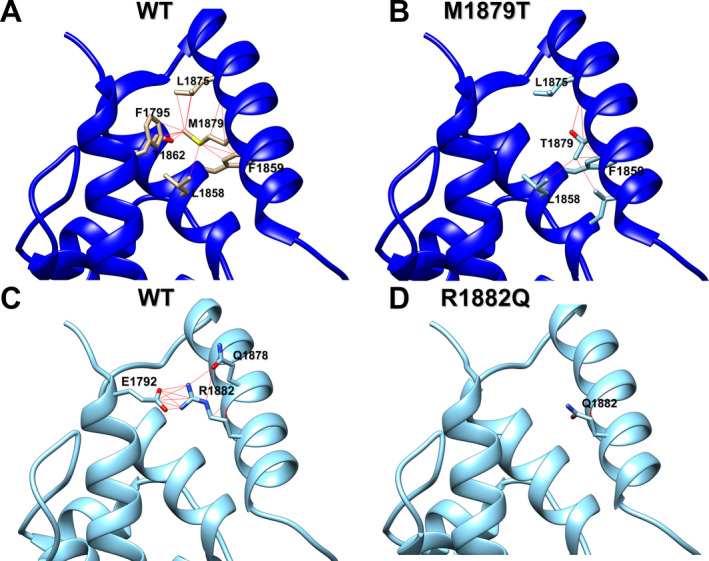
Molecular modeling of M1879T and R1882Q channel contacts in NaV1.2 C‐terminal domain compared to WT. (A) Ribbon diagram of WT channel showing specific contacts between Met‐1879 and interacting residues (red lines). (B) Ribbon diagram of M1879T channel showing specific contacts between Thr‐1879 and interacting residues (red lines). (C) Ribbon diagram of WT channel showing specific contacts between Arg‐1882 and interacting residues (red lines). (D) Ribbon diagram of R1882Q channel showing specific contacts between Gln‐1882 and interacting residues (red lines). See Tables S1 and S2 for list of atomic contacts.
