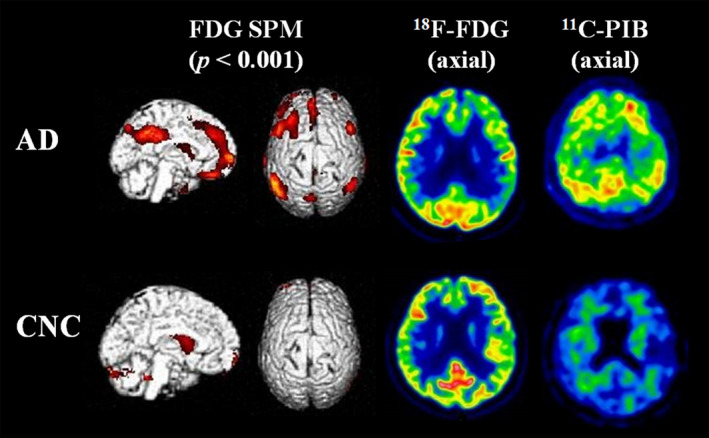
Figure 1.

Representative FDG and PiB PET patterns in patients with AD and NCs. The left two rows show SPM T‐maps (P < 0.001) rendered on the ch2bet template brain. The right two rows display axial images of FDG PET and PiB PET, respectively. Hypometabolism in inferior parietal lobule, precuneus/posterior cingulate gyrus, bilateral dorsolateral frontal lobe, and medial prefrontal cortex on FDG PET and amyloid positivity on PiB PET are seen in a patient with AD. Normal glucose metabolism on FDG PET and amyloid negativity on PiB PET from a healthy individual are also presented. Abbreviations: FDG, fluorodeoxyglucose; SPM, statistical parametric mapping; PiB, Pittsburgh Compound‐B; PET, positron emission tomography; AD, Alzheimer’s disease; NC, normal control.
