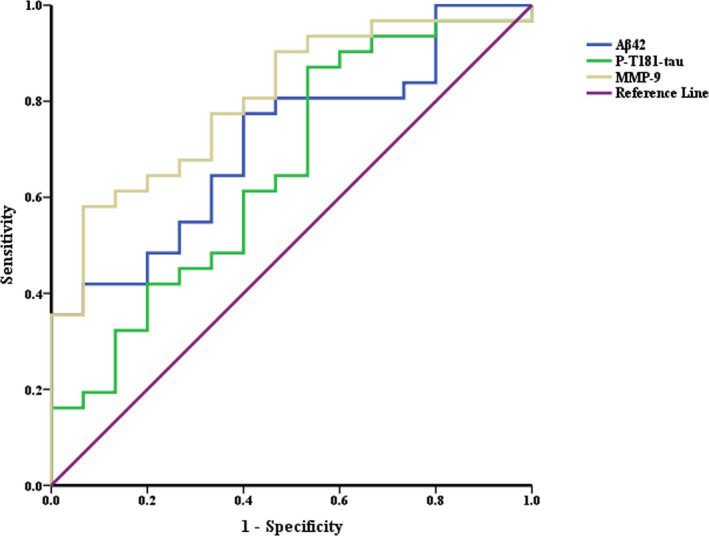
Figure 4.

ROC curves of Aβ42, P‐T181‐tau, and MMP‐9 in plasma NDEVs for discrimination between patients with AD and NCs. The AUC values for Aβ42, P‐T181‐tau, and MMP‐9 were 0.71, 0.66, and 0.80, respectively. The sensitivity and specificity were 77.42% (95% CI 58.46‐89.72) and 60.00% (95% CI 32.89‐82.54) for Aβ42 at a cutoff of 5.51 pg/mL, 80.65% (95% CI 61.94‐91.88) and 55.33% (95% CI 27.42‐77.72) for P‐T181‐tau at a cutoff of 22.96 pg/mL, and 61.29% (95% CI 42.29‐77.58) and 93.33% (95% CI 66.03‐99.65) for MMP‐9 at a cutoff of 2.88 ng/mL. Abbreviations: ROC, receiver operating characteristic; MMP‐9, matrix metalloproteinase 9; NDEVs, neuronally derived extracellular vesicles; AD, Alzheimer’s disease; NCs, normal controls; AUC, area under the curve.
