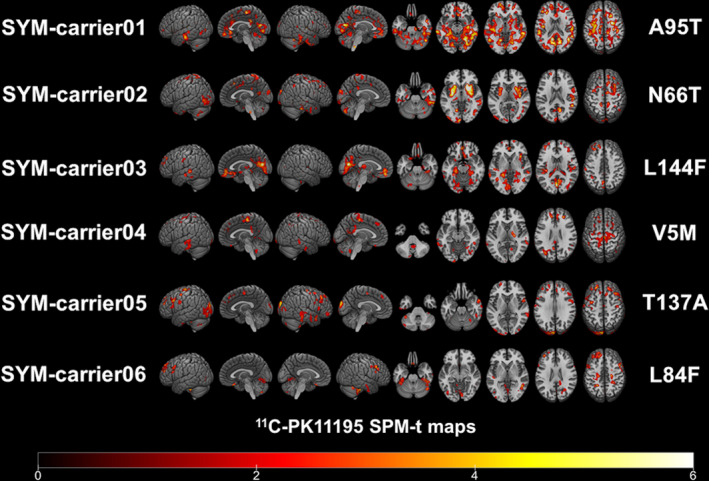
Figure 2.

Single‐subject 11C‐PK11195 BP maps in SYM‐carriers. Single‐subject 11C‐PK11195 Binding Potentials maps are presented in each symptomatic carrier showing the corresponding SOD1 mutation. Statistical threshold of P < 0.01 (uncorrected for multiple comparisons, minimum cluster extent k = 100 voxels).
