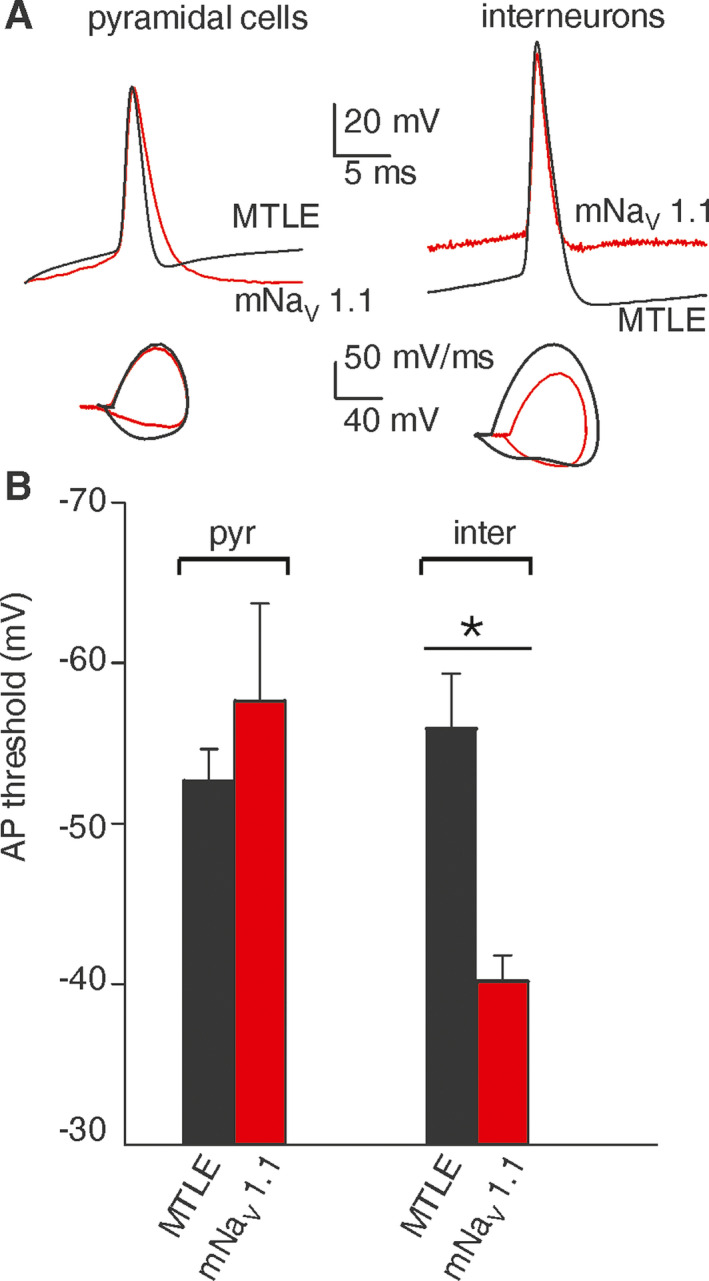
Figure 1.

mNaV 1.1 patient exhibits depolarized action potential (AP) threshold in hippocampal interneurons but not in pyramidal cells. (A) Left top, superimposed AP traces recorded from one pyramidal neuron of the mNaV 1.1 patient (red trace) and from one MTLE patient (black trace, #5); left bottom, superimposed phase‐plane plot obtained from APs showed on top. Right top, superimposed AP traces recorded from one interneuron of mNaV 1.1 patient (red trace) and from the same MTLE patient (black trace); right bottom, superimposed phase‐plane plot obtained from APs showed on top. (B) Bar graph representing the mean action potential threshold values recorded from pyramidal neurons (pyr; n = 10) and interneurons (inter; n = 5) in resected hippocampi of patients with MTLE (black bars, #4‐8, Table S1) and from pyramidal cells (pyr; n = 5) and interneurons (inter; n = 3) of mNaV 1.1 patient (red bars). *P = 0.044; One‐way ANOVA Test, and post hoc Holm–Sidak test.
