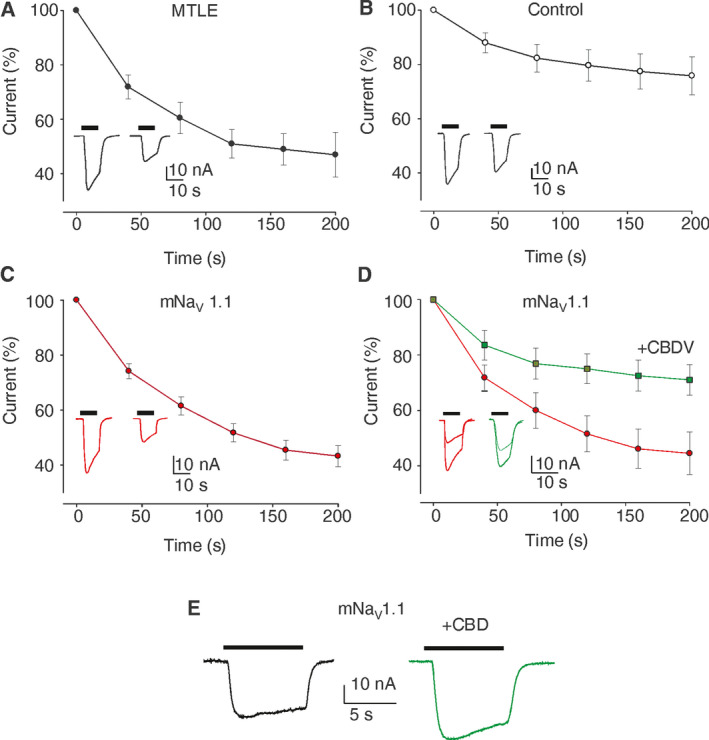
Figure 2.

mNaV 1.1 patient exhibits a GABA current rundown similar to MTLE hippocampal tissues. (A) Oocytes injected with hippocampal membranes of MTLE patients (n = 33; Imax = 40.5 ± 20 nA; #1,2, 4,5 Table S1). Black dots (●) represent the amplitude of consecutive GABA currents as % of the first response (GABA 500 µM). Data points represent means ± SEM. In this and following panels all the currents are normalized to the first current (Imax) and black horizontal bars represent the timing of GABA application. In all experiments, the holding potential was −60 mV. Inset: Representative current traces elicited by the first and sixth GABA application (500 µM, horizontal bar); (B) Oocytes injected with hippocampal membranes from a non‐epileptic control (n = 10; Imax = 49.5 ± 17.3 nA). White dots (○) represent the amplitude of consecutive GABA currents as % of the first response (GABA 500 µM). Inset: Representative current traces as in (A). (C) Oocytes injected with hippocampal membranes from mNaV 1.1 patient (n = 19; Imax = 30.8 ± 5.7 nA). Red dots ( ) represent the amplitude of consecutive GABA currents as % of the first response (GABA 500 µM). (Inset) Representative current traces as in (A). Note the current rundown similar to MTLE patients. (D) Oocytes injected with hippocampal membranes from the mNaV 1.1 patient before and after CBDV treatment. Red dots (
 ) represent the amplitude of consecutive GABA currents as % of the first response (GABA 500 µM) while the green squares
  ) represent the amplitude of consecutive GABA currents on the same cells after 2 hours of incubation with CBDV 50 nM. Data points represent means ± SEM [
 ) Imax = 30.7 ± 8.0 nA; (
 ) Imax = 27.8 ± 7 nA)]. Inset: Representative GABA current traces as in (A), before (red traces) and after 50 nM CBDV application (green traces) as indicated. P = 0.002, n = 19 by Shapiro–Wilk test and Student's t‐test. (E) Representative GABA current traces evoked by 50 µM GABA in one oocyte of 13 injected with membranes of mNaV 1.1 before (black trace) and after CBD co‐application (5 µM, green trace).
