
Figure 5. Distinct Antigen Dosage Impacts for Unencapsulated versus Alginate Encapsulated.
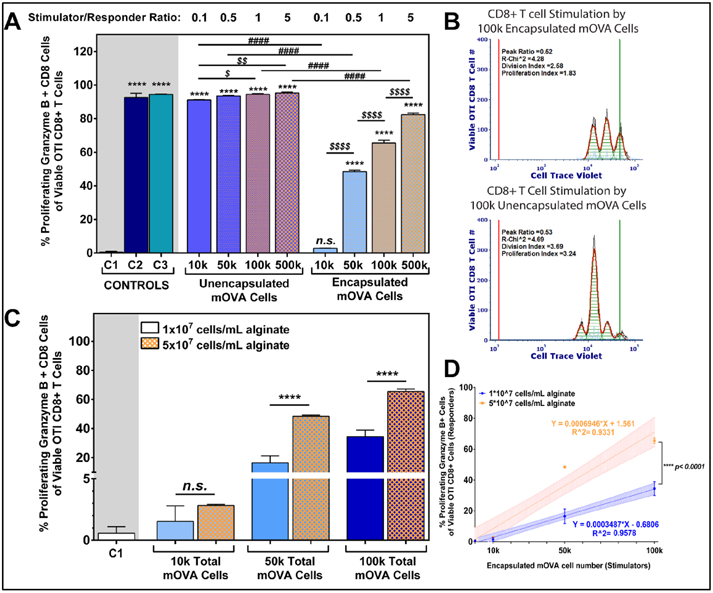
(A) OTI CD8+ T cell activation in response to titration of unencapsulated and encapsulated mOVA stimulator cells in a 48hr coculture (n=3); S/R ratio ranged from 0.1 to 5 (top label). Encapsulation density was 5x10⁷ mOVA cells/mL alginate. Controls: C1: unstimulated; C2: anti-CD3/28 activator beads; C3: 0.1μM SIINFKEL peptide. Mean comparisons to unstimulated control C1 (statistics shown as *); within unencapsulated or encapsulated mOVA stimulators (statistics shown as $); and between unencapsulated and encapsulated stimulators (statistics shown as #) using Tukey's test. (B) Representative proliferation modeling of OTI CD8+ T cells in response to 100,000 unencapsulated or encapsulated mOVA cells, with the black lines represent histogram contour of raw data, green lines marked the undivided population and red lines represent basal signal. For proliferating modeling, the orange lines are the fitted histogram data with the light blue points represent noise events and the green shades as area under the fitted curve. (C) OTI CD8+ T cell activation in response to titration of alginate encapsulated mOVA cells with two different cell densities (1x10⁷ or 5x10⁷ cells/mL alginate; top legend; n=3). Means were compared using Tukey's test. Error = standard deviation. (D) Linear correlation between OTI CD8+ T cells activation levels and encapsulated mOVA cell number with two different densities (1x10⁷ in blue or 5x10⁷ in orange cells/mL alginate; top legend), with the regression equations shown and coefficient of determination labeled as R^2. Shaded area = standard deviation. Slope comparison analysis was performed between the regression curves. Statistical difference was determined as * p<0.05; ** p< 0.01; ****p < 0.0001; n.s. = not significant.