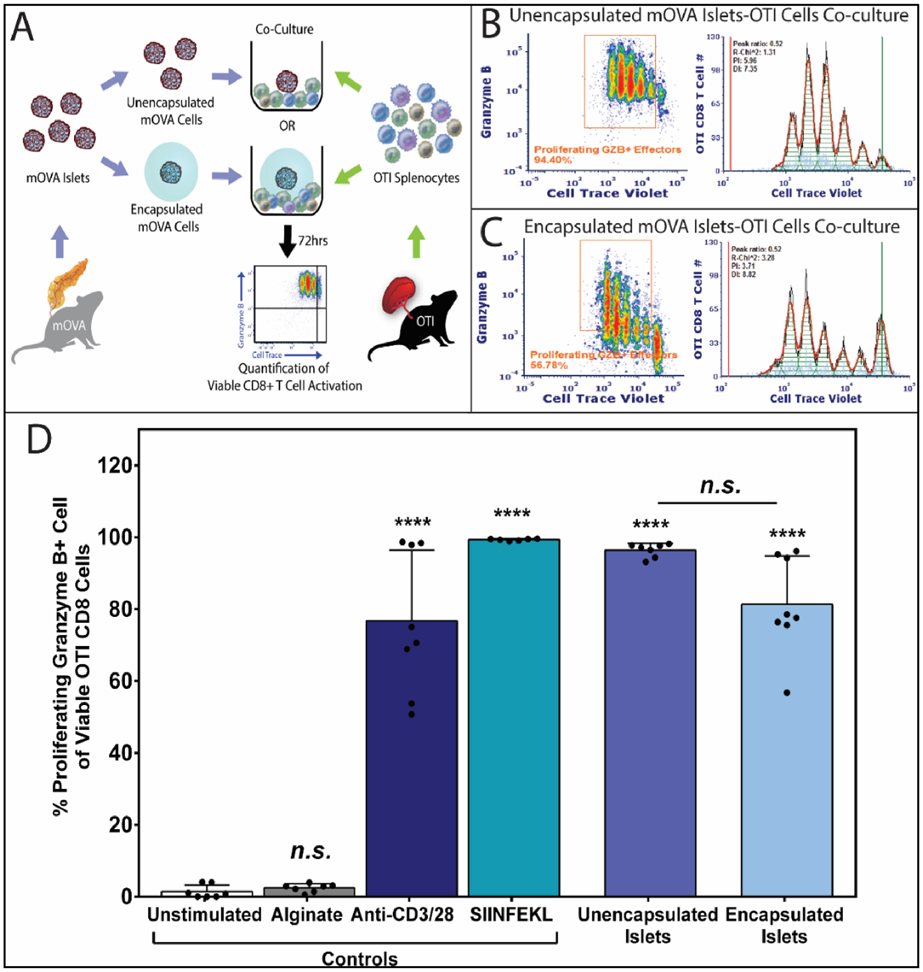
Figure 6. Alginate Encapsulated Islets Effectively Activate Antigen-Specific T cells via the Indirect Antigen Recognition Pathway.

(A) Schematics of OTI splenocytes stimulated by unencapsulated or encapsulated mOVA islets for 72hrs. Antigen-specific CD8+ T cell activation was quantified using the method mentioned above. Representative FCM data of OVA-specific proliferating granzyme B+ OTI CD8+ T cells effector and the respective proliferation fitting when 100,000 OTI responders stimulated by (B) 50 unencapsulated islets or (C) 50 complete encapsulated islets. Proliferation modeling was performed using FCS Express 6 software, with the black lines represent histogram contour of raw data, green lines marked the undivided population and red lines represent basal signal. For proliferating modeling, the orange lines are the fitted histogram data with the light blue points represent noise events and the green shades as area under the fitted curve. (D) Quantification of OVA-specific activated OTI CD8+ T cells, characterized as the percentage of proliferating and granzyme B+ CD8+ T effector cells. Data were shown as mean ± standard deviation of individual data points (N=3; n=9). Outliers were identified using Robust Fit with Cauchy estimate with multiplier K=2, using SAS JMP Pro v13.1.0. software. Tukey’s test was used for mean comparison. Statistical significance was determined as ****p < 0.0001 or n.s. = not significant, with outliers removed for statistical analysis.
