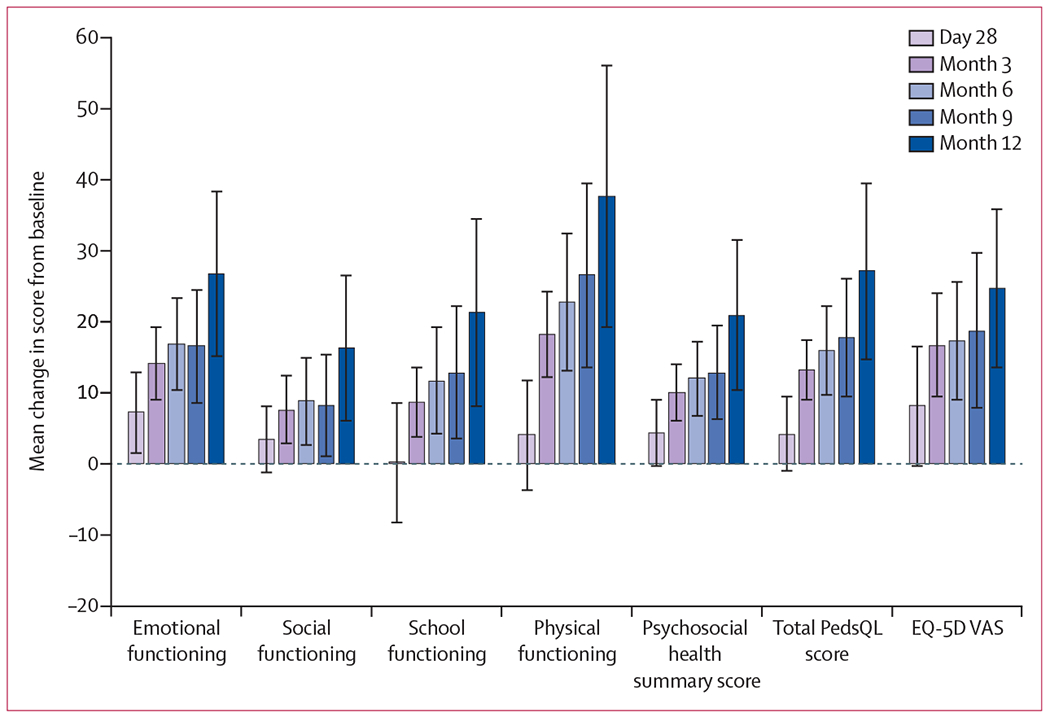
Figure 2: Change from baseline in PedsQL and EQ-5D VAS.

Error bars represent 95% CIs, which were derived from the observed standard errors assuming a t distribution. Analysis was based on patients with non-missing data at both baseline and the postbaseline study assessment of interest. EQ-5D VAS=European Quality of Life-5 Dimensions questionnaire visual analogue scale. PedsQL=Pediatric Quality of Life Inventory.
