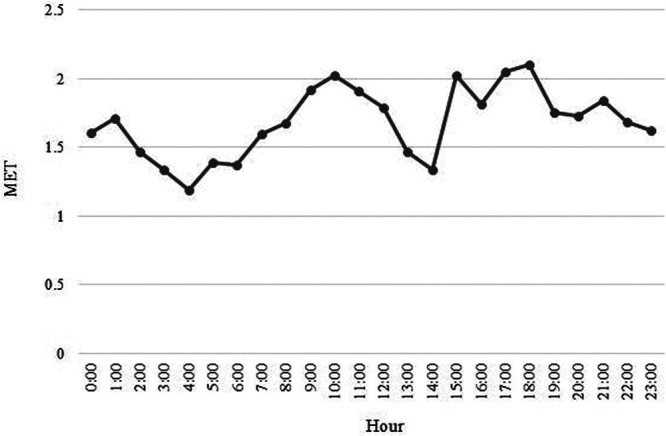
Fig. 1.

Number of METs called per hour per month over the 24-hour day throughout the 6-year study period. Each hour plotted represents the one-hour block starting at that hour. For example, 1 am represents all METs called per hour per month from 1 am to 1:59 am.
