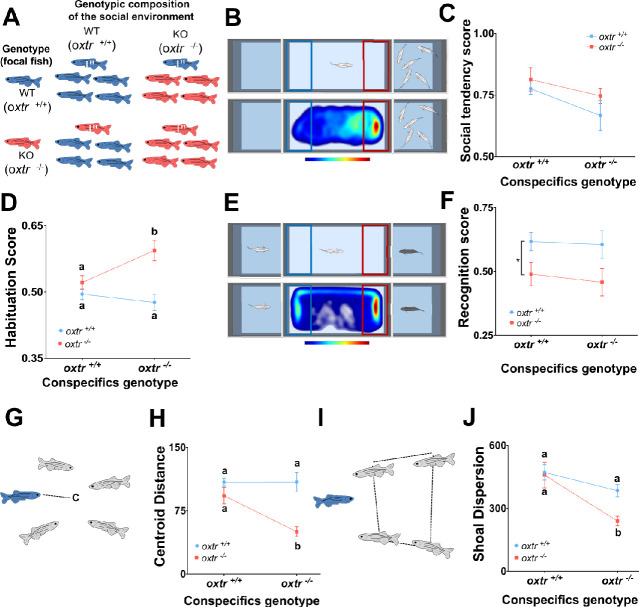
Figure 1. Genetic variation in the social environment affects zebrafish social behavior.
The contribution of the individual genotype (Gi), the genotype of conspecifics in the social group (Gs) and the interaction between the two (GixGs) to the expression of behavioral phenotypes in zebrafish was assessed by raising oxytocin receptor mutant fish and wild types (focal fish marked with *) in shoals of either mutants or wild types (A). Social preference, measured by the time fish spend near a shoal vs. empty in a choice test (B, upper panel), showed a marginally significant effect of Gs (C; Source data file Figure 1—source data 1). Social habituation, which consisted on a consecutive social preference test exhibited a GixGs effect (D; Source data file Figure 1—source data 2). Social recognition, measured as the discrimination between a novel and a familiar conspecific (E, upper panel), shows a pure G effect (F; Source data file Figure 1—source data 3). Social integration, measured as distance to the centroid of the shoal (G), showed a GixGs effect (H; Source data file Figure 1—source data 4). Social influence, measured by the cohesion of the remaining shoal members (I), also showed a marginally significant GixGs effect (J; Source data file Figure 1—source data 5). Heatmaps show the spatial distribution of a representative oxtr(+/+) individual fish raised in a oxtr(+/+) group, during the entire trial, for both social preference (B, lower panel) and social recognition (E, lower panel). Data is presented as mean ± standard error of the mean (SEM). Sample sizes are nine for heterogeneous groups (i.e. focal individual with different genotype from the remaining individuals in the shoal; mutant focal in WT shoals and WT focal in mutant shoals) and 15 for homogeneous groups (i.e. focal individual with the same genotype of the remaining individuals in the shoal; mutant focal in mutant shoals and WT focal in WT shoals). Different letters indicate significant differences (p<0.05) between treatments as assessed by Tukey post-hoc tests following a two-way ANOVA (D,H,J; see Table 1). An asterisk indicates a Gi main effect in F.

