. 2020 Sep 9;9:e58154. doi: 10.7554/eLife.58154

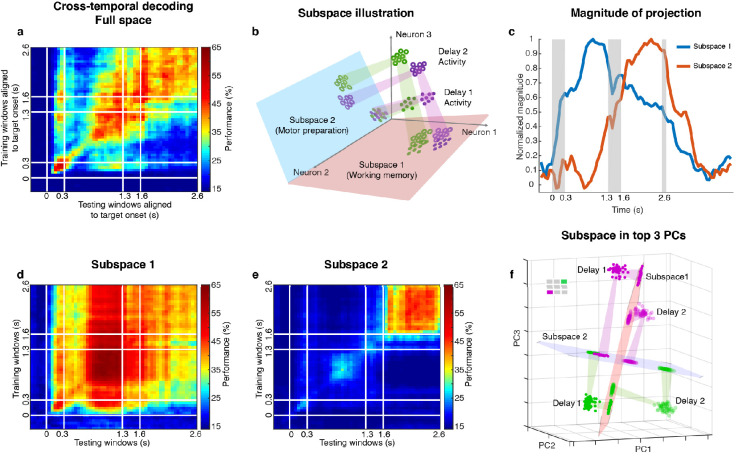
Figure 2. Code morphing, and two minimally dependent subspaces.

(a) Heat map showing the cross-temporal population-decoding performance in the LPFC. White lines indicate target presentation (0–0.3 s), distractor presentation (1.3–1.6 s), and cue onset (2.6 s). (b) Schematic illustration of the projection of the full-space activity into Subspace 1 and Subspace 2. Delay 1 activity (purple and green filled circles) projected into the Subspace 1 would cluster according to target location (filled circles in the red subspace), and because this was a stable subspace, the Delay 2 activity for each target location (purple and green unfilled circles) would overlap with those for Delay 1 (open circles in the red subspace). In Subspace 2, Delay 1 activity would not cluster according to location (filled circles in the blue subspace), and the clustering by location would emerge only from the Delay 2 activity (open circles in the blue subspace) after the emergence of the new information. (c) We projected the trial-averaged full-space population activity for each time bin across the whole trial into Subspace 1 and Subspace 2 and calculated the magnitude of the projections. For each subspace, the magnitude was normalized to have a maximum value of 1. The projections into Subspace 1 and Subspace 2 exhibited different temporal profiles. (d) Cross-temporal decoding performance after projecting full-space activity into Subspace 1. (e) Cross-temporal decoding performance after projecting full-space activity into Subspace 2. (f) Projection of single-trial activity for two target locations (actual locations shown in the upper left corner) onto the first three principal components. Delay 1 is depicted as closed circles, and Delay 2 as open circles. Re-projections into the Subspace 1 (red plane) and Subspace 2 (blue plane) are shown and guided by projection cones (green and purple cones connecting the PCA projections into the subspace re-projections).

Figure 2.

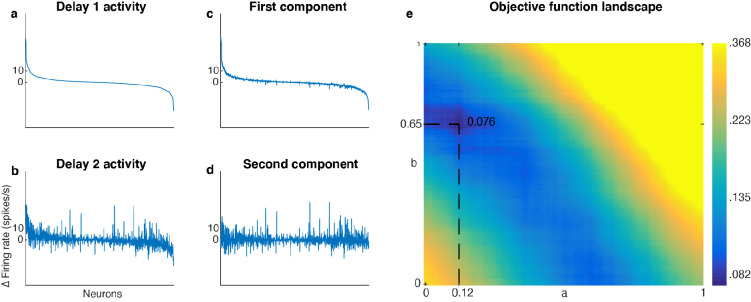
Figure 2—figure supplement 1. Unmixed population activity between Delay 1 and Delay 2.

Figure 2—figure supplement 1.

(a) Delay 1 population activity for all seven target locations sorted according to firing rate. The x-axis has 1582 points (226 cells x seven locations). Each neuron’s firing rate for the last 500 ms of Delay 1 on each trial was averaged across time, before being averaged across trials in each location. This was then subtracted by the average baseline firing rate (averaged across 300 ms prior to target presentation before averaging across trials). The neurons were sorted in descending order by the Delay 1 activity (a to d).( b) Delay 2 population activity, significantly correlated with Delay 1 activity (r = 0.69, p < 0.001, mutual information = 0.33 bits). (c) The unmixed Element 1. (d) The unmixed Element 2, has minimal mutual information with Element 1 (r = 0.017, p = 0.5, mutual information = 0.076 bits). (e) Heatmap showing the landscape of the objective function for unmixing Delay 1 and Delay 2 activity. There was a global minimum when a = 0.12 and b = 0.65.

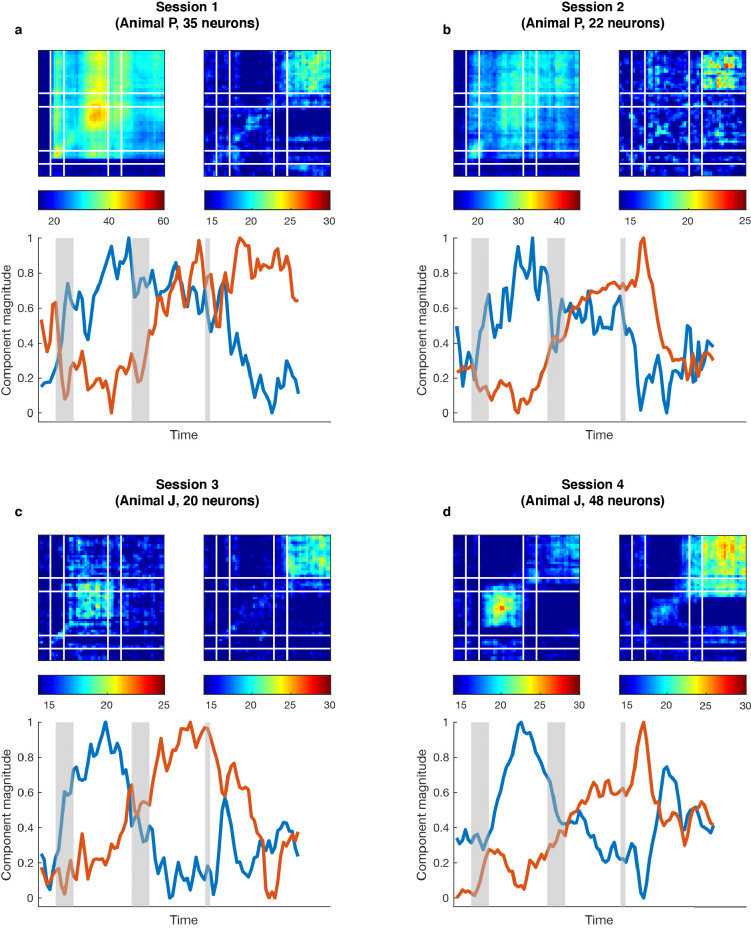
Figure 2—figure supplement 2. Single-session subspace identification.

Figure 2—figure supplement 2.

For each single session in the two monkeys, we applied the unmixing method to the activity of simultaneously recorded neurons rather than a pseudo-population. (a) Top left, cross-temporal decoding performed in the working memory subspace identified from 35 simultaneously recorded neurons. DM11 = 41.0 ± 1.7% (trained and tested in Delay 1 in the working memory subspace), DM22 = 31.1 ± 1.8% (trained and tested in Delay 2 in the working memory subspace). Top right, cross-temporal decoding performed in the motor preparation subspace identified from the same population of neurons. DP11 = 16.5 ± 1.6%, DP22 = 20.8 ± 1.9%. Bottom, projection magnitude of full-space activity into each subspace (refer to Figure 1d). (b), Same as (a), but for another single session from Animal P. DM11 = 26.2 ± 1.4%, DM22 = 23.8 ± 1.2%, DP11 = 15.1 ± 1.2%, DP22 = 19.0 ± 1.1%. (c), Same as (a), but for a single session from Animal J. DM11 = 17.8 ± 0.9%, DM22 = 14.6 ± 0.7%, DP11 = 15.0 ± 0.9%, DP22 = 19.8 ± 0.8%. (d Same as c) but for another single session from Animal J. DM11 = 21.2 ± 1.0%, DM22 = 17.2 ± 0.9%, DP11 = 16.0 ± 1.1%, DP22 = 23.3 ± 0.9%. The single-session results showed higher decoding performance in Delay 1 than in Delay 2 in the working memory subspace, higher decoding performance in Delay 2 than in Delay 1 in the motor preparation subspace, and the projection magnitude into the two subspaces showed different temporal profiles, consistent with the results obtained from the pseudo-population analysis in Figure 1. This analysis validates the existence of working memory and motor preparation subspaces in simultaneously recorded neurons in different animals.

Figure 2—figure supplement 3. Effective dimension of full-space data in the subspaces.
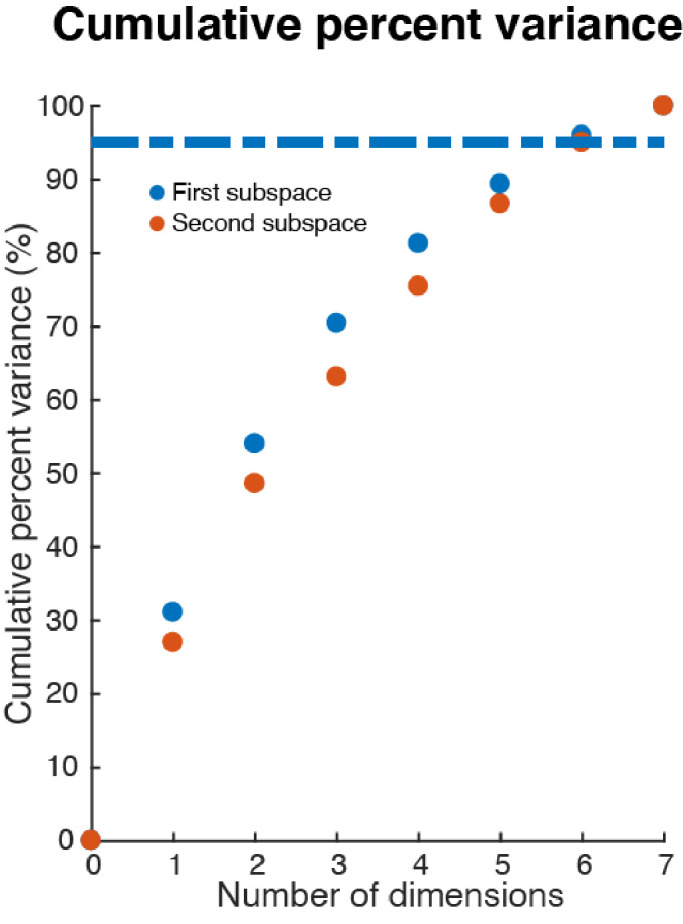
Figure 2—figure supplement 3.

We projected single-trial full-space activity (250 pseudo-trials each location, seven locations) from both Delay 1 and Delay 2 (time-averaged in each period) into the two subspaces. We then performed a PCA on the projected data, and calculated the cumulative percent variance explained by the principal components in each projection. In each subspace, six PCs were needed to explain more than 95% of the variance within the subspace.

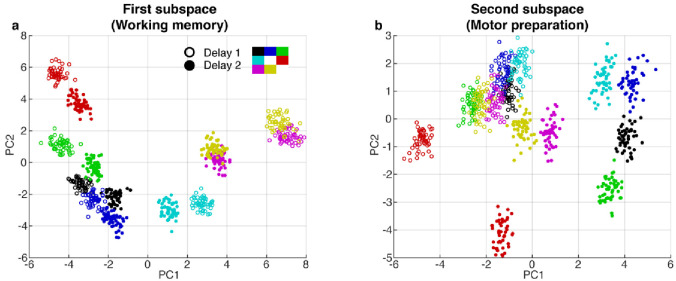
Figure 2—figure supplement 4. PCA projections in the first and second subspaces.

Figure 2—figure supplement 4.

(a) Delay 1 and Delay 2 activity for 50 trials at each target location projected into the first subspace (top 2 PCs). Open circle, Delay 1 activity; closed circle, Delay 2 activity. Target locations are color coded according to the legend. Delay 2 clusters appeared to move closer to each other compared to the Delay 1 clusters. This meant that the boundaries of the classifiers trained in Delay 2 would work better for Delay 1 activity, compared to the opposite scenario, as seen in the off-diagonal quadrants in Figure 1d. (b), Delay 1 and Delay 2 activity projected into the motor preparation subspace (top 2 PCs). The clusters exhibited significant overlap during Delay 1, but separated into distinct clusters in Delay 2.

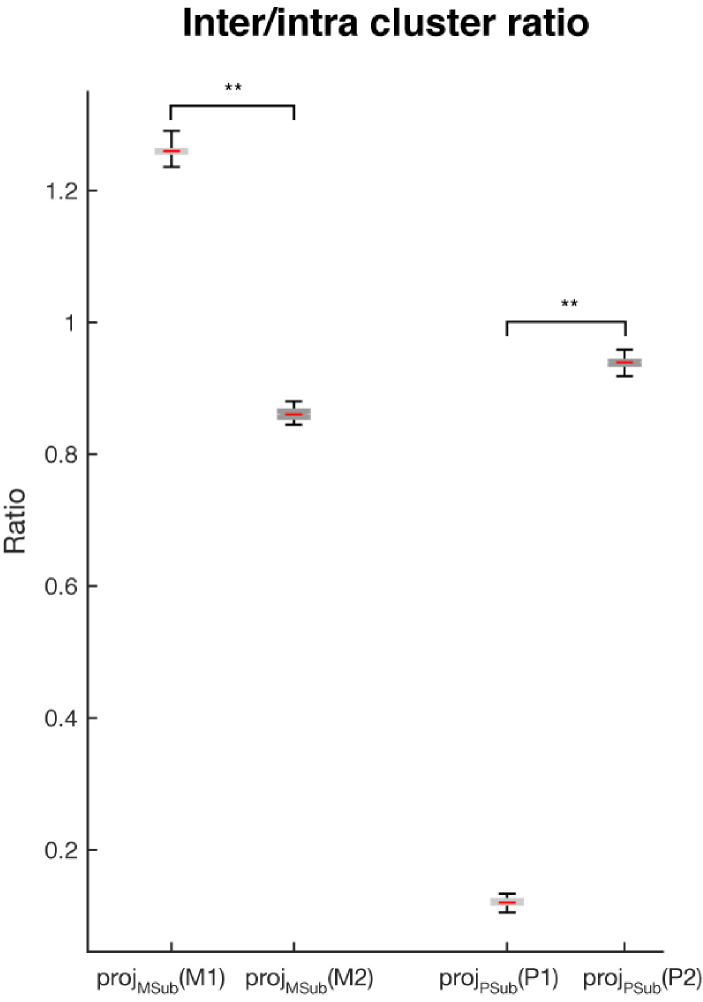
Figure 2—figure supplement 5. Inter- and intra-cluster distance analysis.

Figure 2—figure supplement 5.

The ratios of the inter-cluster distance (the average of the pairwise Euclidean distance between cluster means) and the intra-cluster distance (the average of the pairwise distances between samples within each cluster, which were then further averaged across clusters) are shown for: projMSub(M1) - projection of the single-trial working memory activity in Delay 1 into the working memory subspace; projMSub(M2) – single-trial working memory activity in Delay 2 projected into the working memory subspace; projPSub(P1) – single-trial motor preparation activity in Delay 1 projected into the motor preparation subspace; and projPSub(P2) – single-trial motor preparation activity in Delay 2 projected into the motor preparation subspace. Asterisks (**), significant (i.e. 95th percentile range of the two distributions did not overlap).

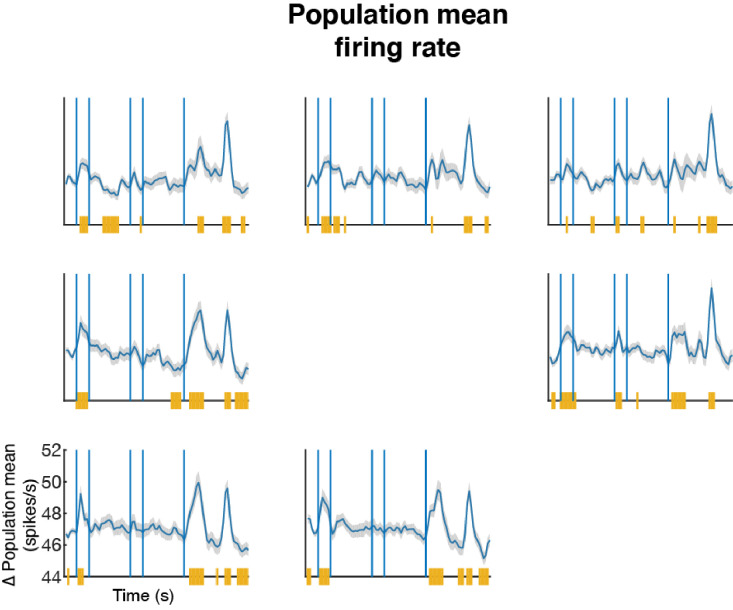
Figure 2—figure supplement 6. Mean population firing rate.

Figure 2—figure supplement 6.

We trial-averaged each cell’s firing rate according to the target condition in each time bin and then averaged across neurons. The blue line indicates the mean firing rate of the population (226 cells). The shaded area represents the standard error. The yellow line indicates time bins in which the population firing rate was significantly different from baseline (mean of the fixation period, which was 300 ms prior to the target presentation, T-test, p < 0.05).

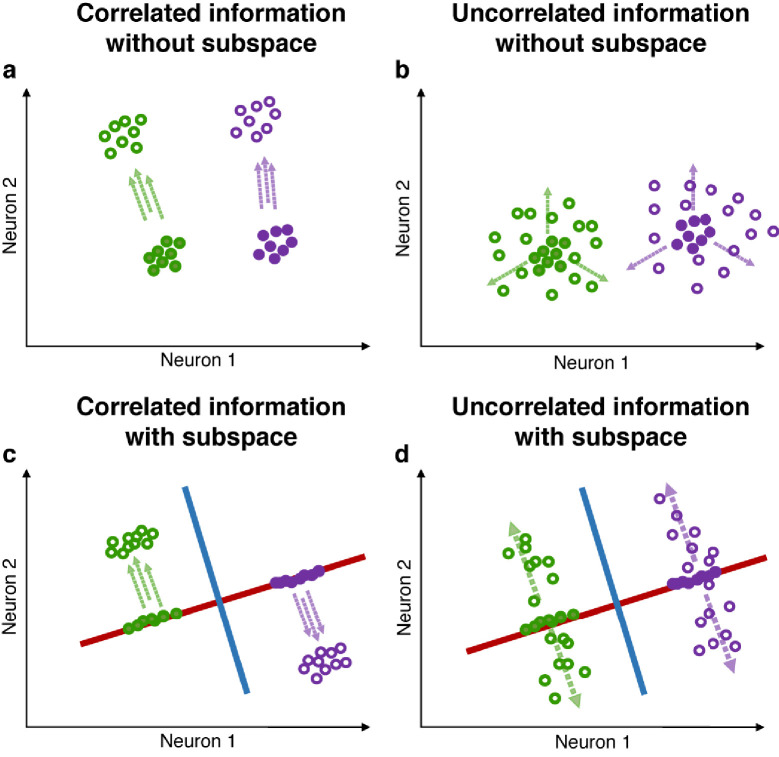
Figure 2—figure supplement 7. Correlated and uncorrelated information.

Figure 2—figure supplement 7.

(a) Illustration of correlated information (in this example, two possible target locations and three possible stimulus colors, one target location is associated with only one stimulus color). Green and purple circles represent neuronal activity grouped by different target locations. Closed circles represent trial epochs containing only location information, while open circles represent trial epochs with color information incorporated into the location information. When trials are grouped by locations, the addition of correlated color activity will shift the location clusters only in the direction indicated by the parallel dashed arrows, and may not result in a decrease in the ratio of inter/intra-cluster distance. (b) In the case where target location and stimulus color are uncorrelated (each stimulus color is equally likely to appear in each target location), the addition of uncorrelated color activity (indicated by the three dashed arrows) will ‘diffuse’ clusters representing target location, thus resulting in a decrease in the ratio of inter/intra-cluster distances. (c and d) Red and blue lines represent the location and color subspaces. In both scenarios (correlated and uncorrelated information), independent location and color subspaces will alleviate the interference between the two pieces of information, as the ratio of inter/intra-cluster distance in one subspace is largely unaffected by changes in activity in the other subspace.