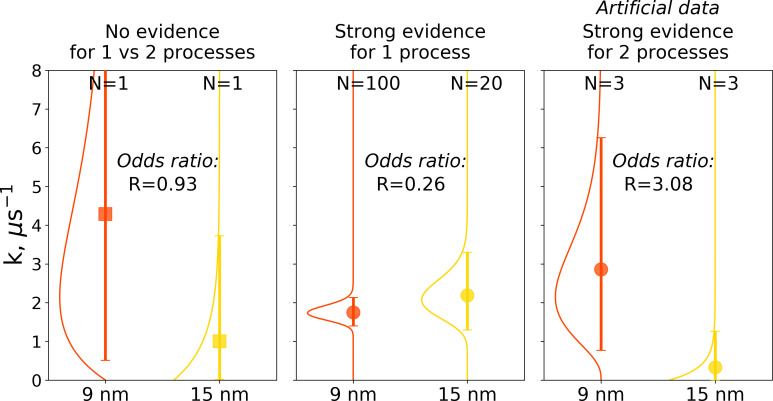
Figure 10. Illustration of Bayes factors (odds ratio) for three scenarios.
The panels show distributions, together with means and 95% credible intervals for hemoglobin’s T to R transition rate constant. The distributions were calculated based on the Bayesian formalism using a uniform prior. In the left panel, data from N = 1 simulations was used: the transition was observed after 0.466 μs in the smaller 9 nm box, but no transition in the larger 15 nm box occurred in 1 μs. In this case, the odds ratio is ∼1 indicating that the data provide no evidence to make a conclusion whether the kinetics in two boxes is governed by one or two disparate processes. The middle panel uses data from 100 simulations for the 9 nm box and 20 trajectories in 15 nm box: numerous transitions in both boxes have been observed within 1 μs. In this scenario, the odds ratio is lower than 0.33, hence providing strong evidence supporting the claim that the kinetics in both boxes is governed by one process. While distributions for the left and middle panels came directly from the simulation data reported in El Hage et al., 2018, Gapsys and de Groot, 2019 and from this work, for an illustration in the panel on the right, we needed to resort to an artificial hypothetical case, as none of the simulation data showed evidence for two separate processes governing kinetics in boxes of different size. Therefore, we constructed a synthetic data set where the observations that a transition in 9 nm box occurs in 0.466 μs and no transition happens in 15 nm box within 1 μs were repeated three times each. This resulted in an odds ratio larger than 3, providing strong evidence that the kinetics in the two boxes is governed by two distinct processes.

