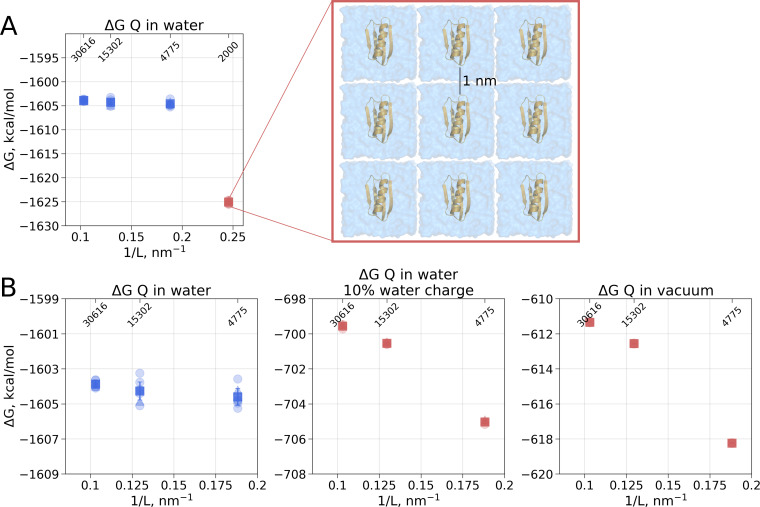
Figure 3. Illustration of artifacts introduced in the solvation calculation upon charge introduction.
(A) Strongly reduced simulation box size has an effect on the calculated value. Protein interactions with its periodic image and interactions of the solvation shells of the solute have a significant impact. (B) The effect of electrostatic screening by water molecules. The values in the panel on the left were obtained with the regular TIP3P water and show no box size dependence. Once water screening is reduced by scaling water charges to 10% of their original value (middle panel), the estimated values start approaching those obtained in vacuum simulations (right panel). In (A) and (B) blue markers denote those cases that are box size independent, while red symbols are for the box size-dependent Circles denote values obtained from individual free energy perturbation (FEP) calculations, triangle symbol marks those FEP runs where Hamiltonian replica exchange (HREX) was used, squares mark averages over the individual calculations. Upper x-axis marks the number of waters in the system.

