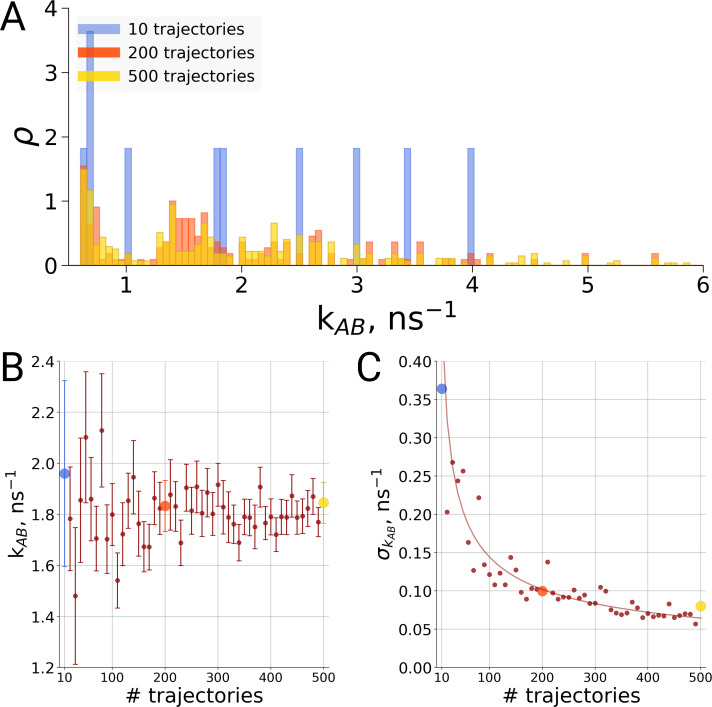
Figure 6. Rate estimate dependence on the number of transitions between the two main conformations of alanine dipeptide (backbone dihedral angle ψ is used as a reaction coordinate), the examined conformations are described in detail in Gapsys and de Groot, 2019.
Panel A shows a distribution of transition frequencies for sample sizes of 10, 200 and 500 trajectories. In B, the rate estimate is shown as a function of the number of trajectories and in C the associated uncertainty is plotted. In B and C the sample sizes of 10, 200 and 500 are highlighted with blue, orange and yellow spheres, respectively. The line in panel C depicts 1/, scaled to the least squares fit uncertainty.

