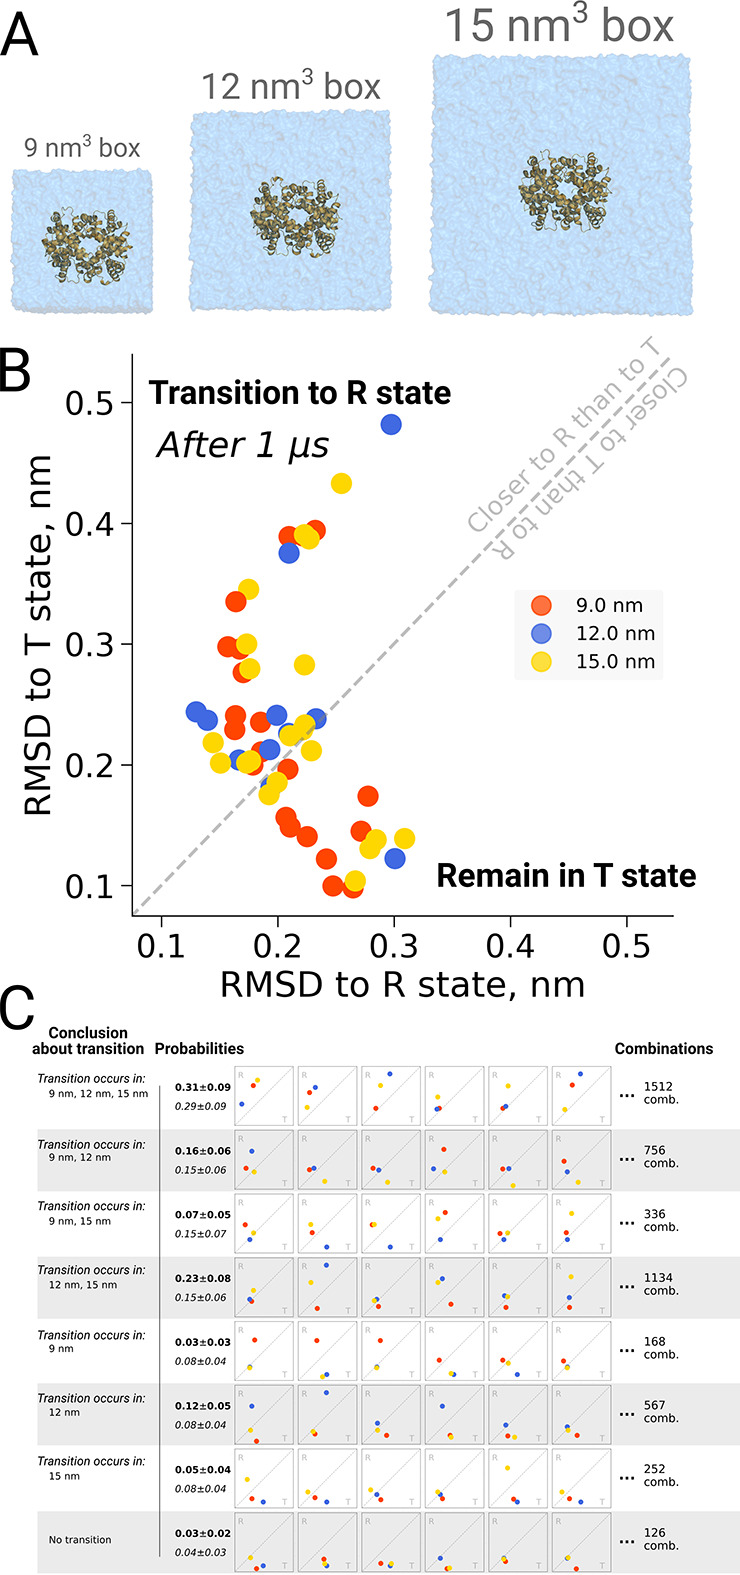
Figure 7. Hemoglobin kinetics.

The simulations of hemoglobin were performed in 3 different simulation boxes (A). Panel B depicts the end states in terms of RMSD to the R and T states after 1 μs of simulation. Here, we used the data from El Hage et al., 2018 and Gapsys and de Groot, 2019. In total, 21 simulations were considered in the 9 nm and 15 nm boxes, and 11 simulations in the 12 nm box. In panel C we illustrate the numerous combinations that could be obtained from these simulations if only one simulation per box had been performed. Each of those individual combinations could lead to one of 8 conclusions about the box size dependence of hemoglobin transitions: the probabilities for these conclusions based on the currently used data are provided in bold font. We also provide probabilities (italic font) for reaching the conclusions with a condition that the same transition in each of the simulation boxes occurs with the same probability (this probability was calculated by considering the data from all the simulation boxes together).
