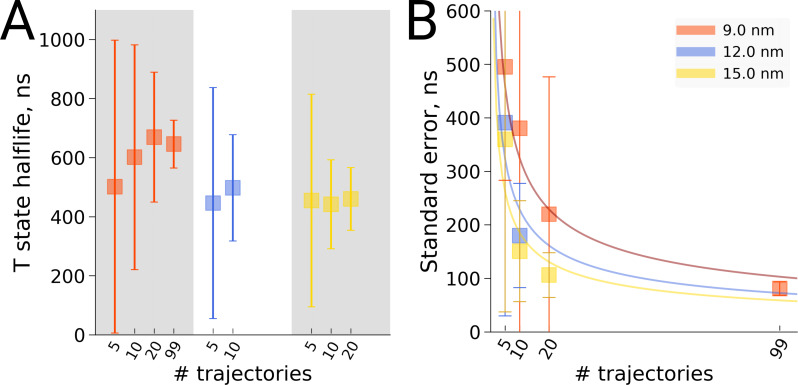
Figure 8. Hemoglobin T state half-life statistics.
The simulations in 3 differently sized boxes were considered (A). The average half-lives together with the associated standard errors were estimated for various numbers of trajectories. In panel B we demonstrate the 1/ behaviour of the standard errors with respect to the number N of the trajectories considered. The error bars in panel B denote standard errors indicating that the differences between the standard errors of the estimated half lives are statistically insignificant.

