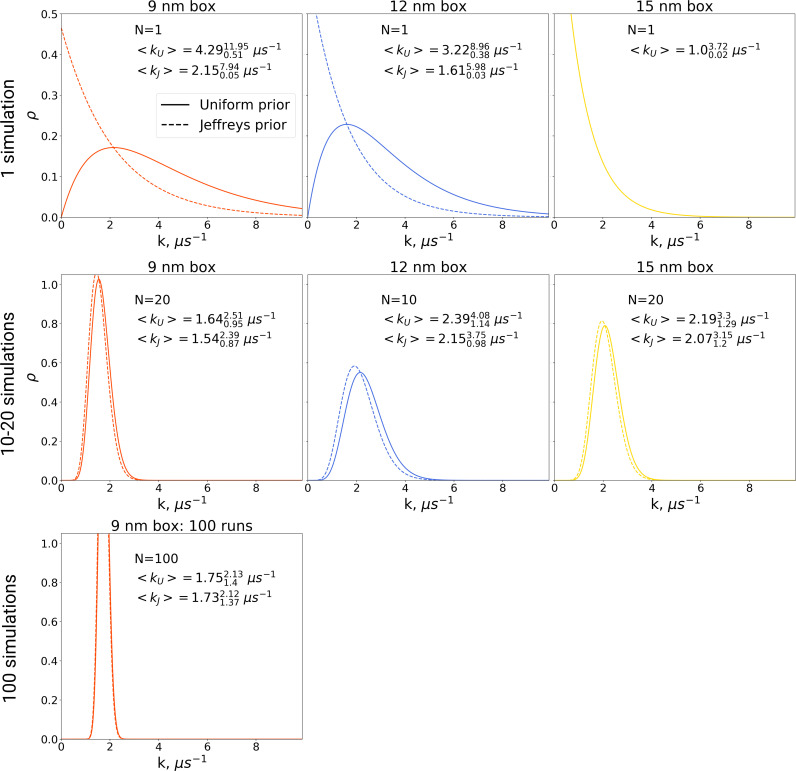
Figure 9. The rate constants for hemoglobin’s T to R transitions were estimated based on Bayesian formalism following the theory by Ensign and Pande, 2009.
The figure shows posterior distributions of the rate constants. Two priors were used: uniform (solid line, subscript U) and Jeffreys prior (dashed line, subscript J). Expected rate estimates with credible 95% intervals are reported in each panel. N marks the number of simulations used to construct the respective distributions. With more simulations performed, the rate constant distributions become narrower. As the Jeffreys prior is only applicable for the cases where at least one barrier crossing event is observed, for the El Hage et al., 2018 hemoglobin simulations in 15 nm box, where no transitions occurred (upper right panel), we only report the rate distribution based on the uniform prior.

