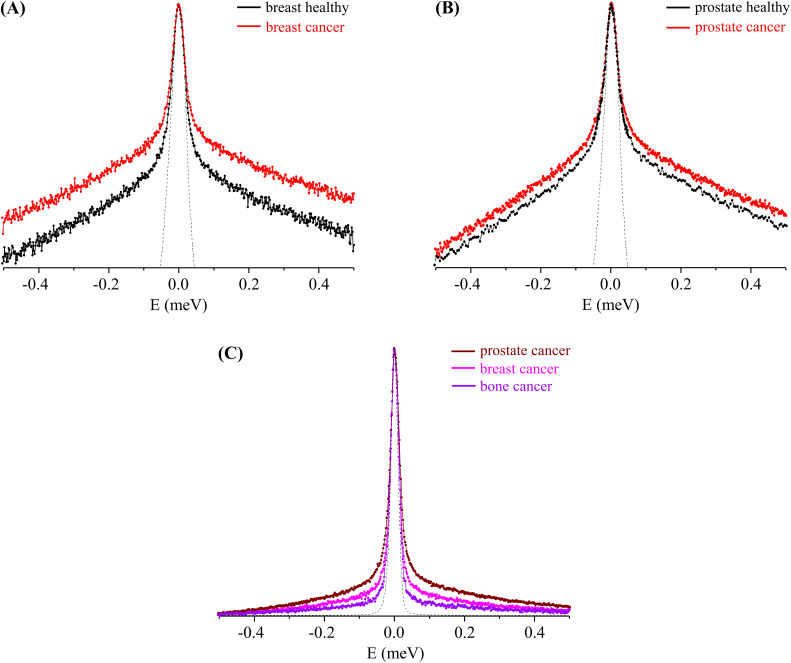
FIG. 1.
QENS profiles (310 K, at Q = 1.684 Å−1) for cancer and healthy human cells: (a) breast cancer and breast healthy, (b) prostate cancer and prostate healthy, and (c) all cancer cells studied—breast, prostate, and bone (the spectra were normalized to the maximum peak intensity. The dashed line represents the instrument resolution, as measured by a standard vanadium sample. The QENS profiles (a) and (b) are represented in the yy´ logarithmic scale).

