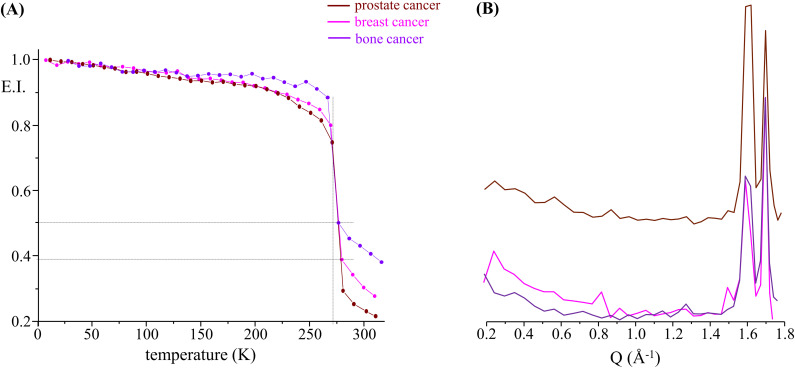
FIG. 2.
Elastic scan plots as a function of T (a) and of Q (at 270 K) (b), for all cancer cells studied—breast, prostate, and bone cancers [in (a), the plots represent the elastic intensity integrated over the OSIRIS instrumental resolution, normalized to the elastic intensity obtained at the lowest temperature (10 K)].

