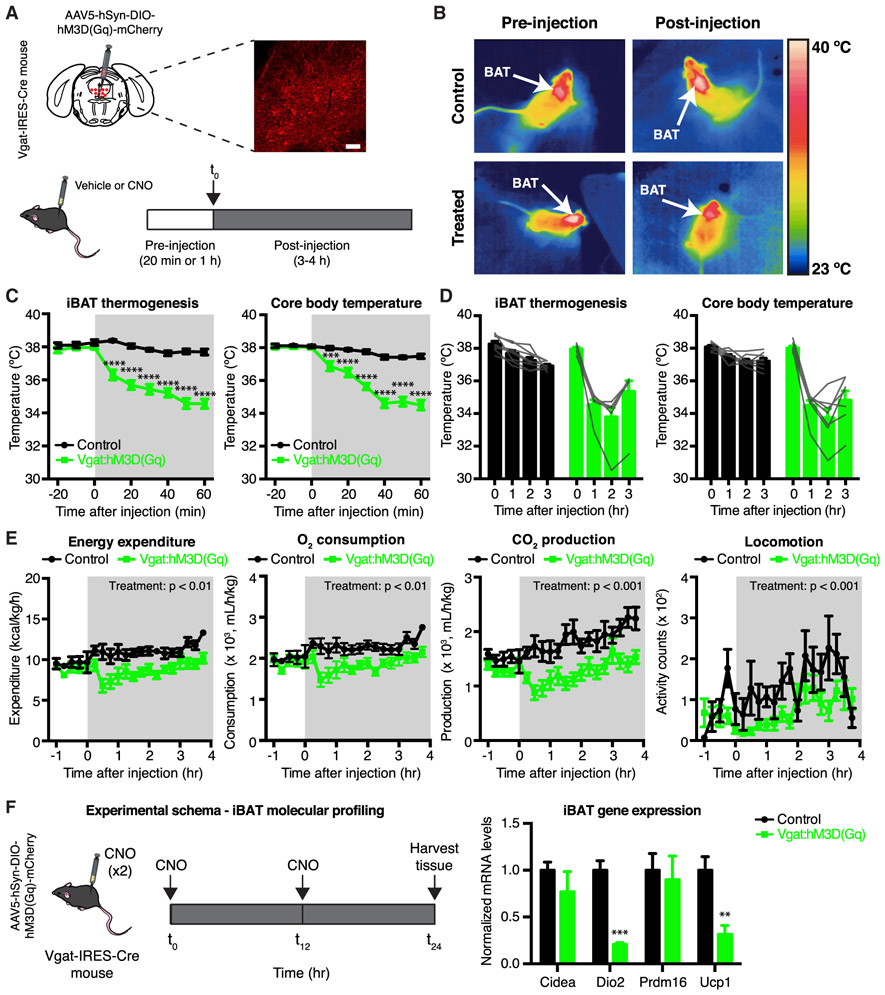
Figure 2. Chemogenetic Activation of DRNVgat Neurons Suppresses Energy Expenditure.
(A) Experimental schema and representative IHC for DRNVgat neurons infected with excitatory DREADD hM3D(Gq).
(B) Representative thermal images of iBAT (control or Vgat:hM3D(Gq)) before and after injection of CNO. Chemogenetic activation of DRNVgat neurons suppresses iBAT thermogenesis.
(C and D) Short- and long-term changes in iBAT and core temperature after chemogenetic activation of DRNVgat neurons. (C) Activation of DRNVgat neurons significantly suppresses iBAT (treatment: p < 0.0001) and core temperature (treatment: p < 0.0001). Two-way repeated measures (RM) ANOVA comparing control and treated groups (n = 7–8 mice per group). (D) Average iBAT and core temperature at 0–3 h post-CNO injection. iBAT (p < 0.0001) and core (p < 0.0001) temperatures remain significantly suppressed 3 h post-CNO injection. Two-way RM ANOVA comparing t = 0 and t = 3 h post-CNO injection (n = 7–8 mice per group).
(E) Chemogenetic activation of DRNVgat neurons suppresses locomotor activity (treatment: p < 0.001), oxygen consumption (treatment: p < 0.01), carbon dioxide production (treatment: p < 0.001), and total energy expenditure (treatment: p < 0.01). Two-way RM ANOVA comparing control and treated groups after CNO injection (n = 7–8 mice per group).
(F) Molecular profiling of iBAT after chemogenetic activation of DRNVgat neurons. Genes tested: Cidea (p > 0.05), Dio2 (p < 0.001), Prdm16 (p > 0.05), Ucp1 (p < 0.01). Unpaired t tests comparing treatments (n = 4–5 samples per group).
Scale bar, 100 μm. **p < 0.01, ***p < 0.001, ****p < 0.0001. Data are presented as mean ± SEM.
See also Figure S2.

