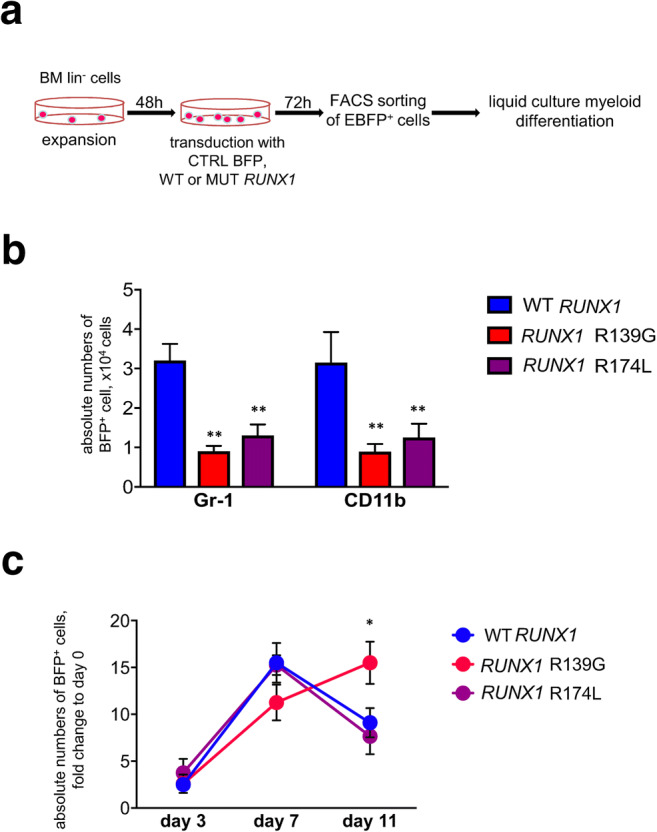
Fig. 2.

Liquid culture differentiation of transduced d715 Csf3r HSPCs. a Schematic of the workflow for liquid culture myeloid differentiation of transduced bone marrow lin− cells obtained from C57BL/6-d715 Csf3r mice. b Transduced cells were subjected to liquid culture myeloid differentiation (see “Material and methods” for details). FACS was used to count the myeloid and granulocytic cells on day 11 of culture. Graph bars represent absolute cell counts of Gr-1+ or CD11b+ cells. Data represent means ± SD from triplicates of two independent experiments; **p < 0.01
