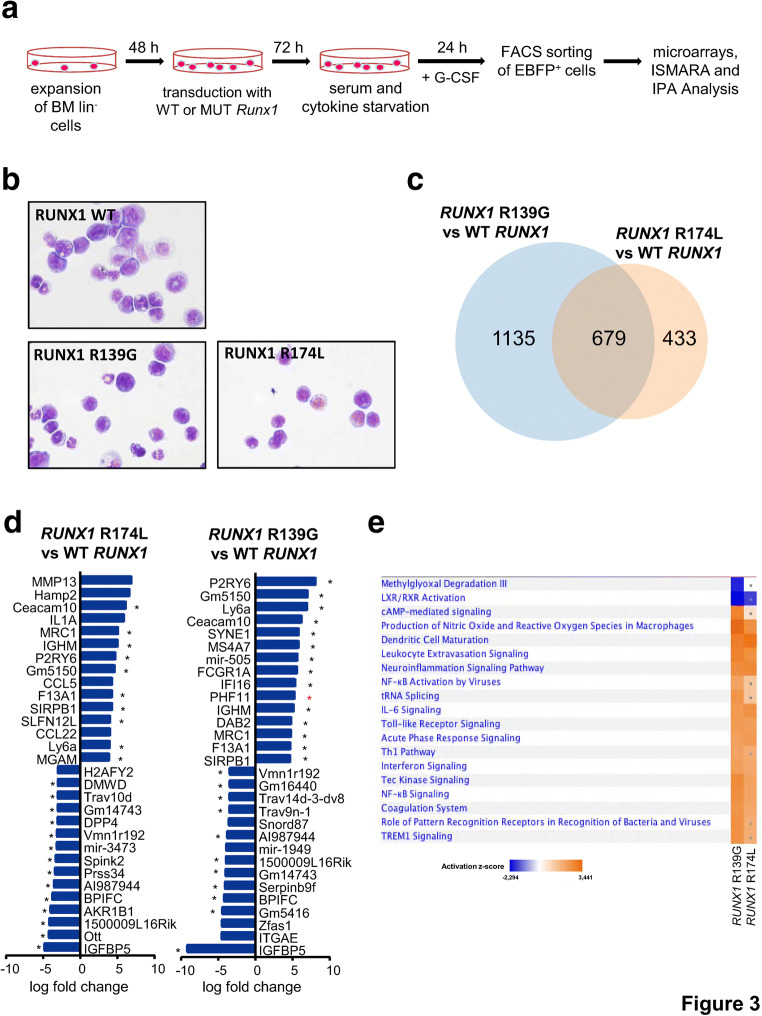
Fig. 3.
Canonical pathway analysis of microarray data obtained from transduced d715 Csf3r HSPCs. a Schematic of the experimental procedure performed for microarray analysis. The experiment was conducted in duplicate. After quality control analysis, one sample from the RUNX1-R139G group was excluded from the final analysis. b Wright–Giemsa–stained cytospin preparations of Csf3r lin− cells transduced with RUNX1 WT and mutants and sorted for fluorescent protein expression. Images were acquired at × 630 magnification. c Venn diagram depicting the overlay of significantly up- or downregulated transcripts in each RUNX1 mutant group, as compared with WT RUNX1–transduced cells. d Canonical pathways that were significantly (−log(p value) > 1.3) enriched and significantly predicted (z-value > 2 and < − 2) to be up- or downregulated in each RUNX1 mutant group compared with WT RUNX1–transduced cells. Shared pathways are marked with an asterisk (*). e IPA analysis of the significantly regulated pathways shared by lin− cells transduced with each RUNX1 mutant, as compared with WT RUNX1–overexpressing samples. Upregulated pathways are shown in orange, and downregulated pathways are shown in blue

