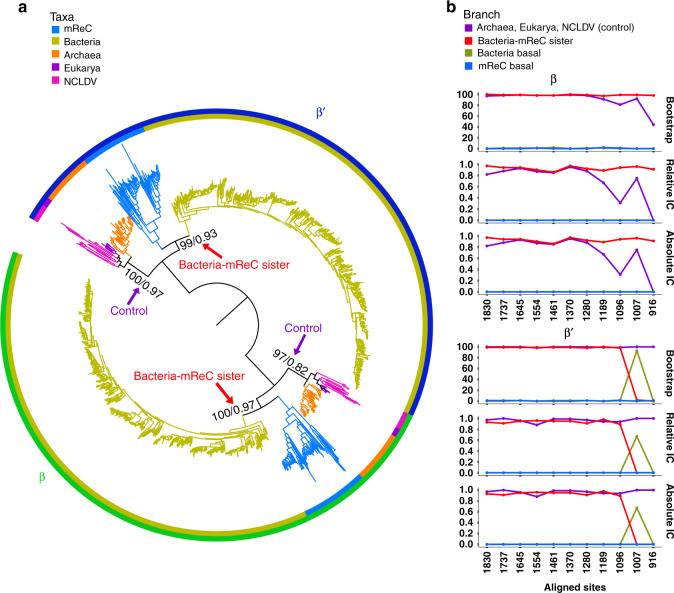
Fig. 6. Paralogy-based rooting analysis of the RNAP tree.
a Rooted tree of β- and β′-subunits. Homologs of the β- and β′-subunits used for Eukarya were RPB2 and RPB1, and homologs B and A used for Archaea, respectively. Amino acid sequences for each subunit were aligned to each other, and phylogeny was constructed using maximum likelihood with the amino acid substitution model LG + C60 + F + Γ4. Branch color and inner ring color strip corresponds to taxonomic group. Outer ring color strip corresponds to subunit β (green) and β′ (blue). At selected branches, first number refers to ultrafast bootstrap support of 1000 replicates reported as a percent out of 100 and the second number refers to relative Internode Certainty (IC) value out of 1. Arrows point to branches used to assess support of trees as fast-evolving sites were removed (see “Methods”). b Line plots of branch support corresponding to different hypotheses in the β (upper) and β′ (lower) clusters as fast-evolving sites are removed in steps of 5% until 50% of the fastest evolving sites are removed from the alignment (see “Methods”). Purple corresponds to branch support of Archaea, Eukarya, and NCLDV RNAP together. Blue line corresponds to the branch supporting mReC RNAP is basal to all other lineages considered. Yellow line corresponds to the branch supporting bacterial RNAP is basal to all other lineages considered. Red line corresponds to the branch supporting that mReC and bacterial RNAP diverged together prior to other groups. Instructions for accessing full trees with support values can be found in the “Data availability” section.

