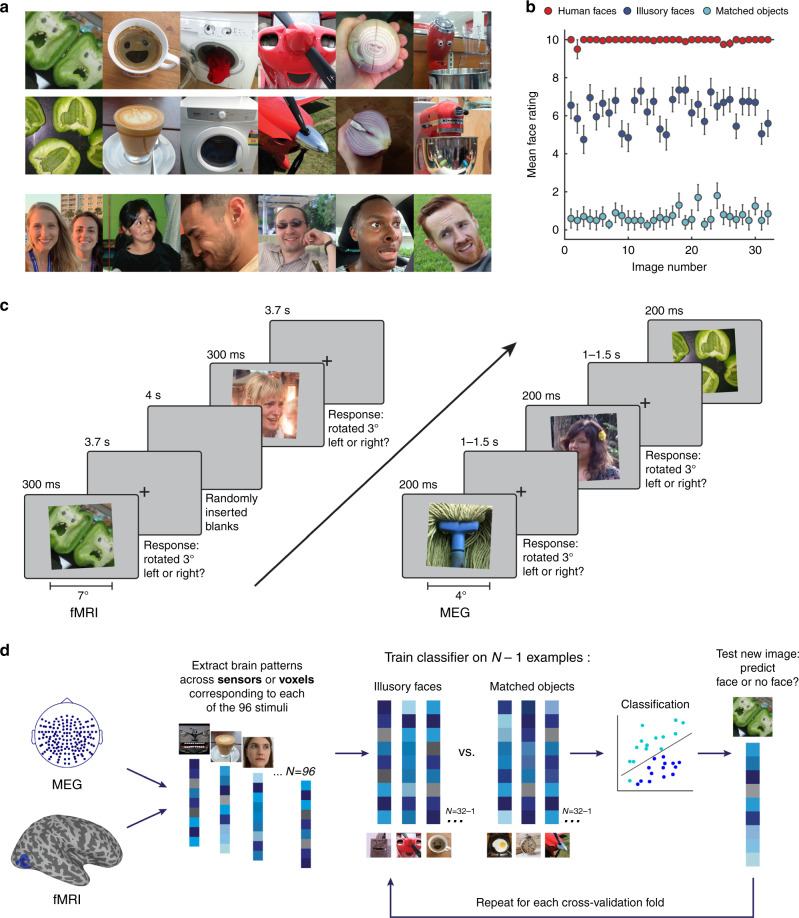
Fig. 1. Experimental design and analysis.
a Example visual stimuli from the set of 96 photographs used in all experiments. The set included 32 illusory faces, 32 matched objects without an illusory face, and 32 human faces. Note that the human face images used in the experiments are not shown in the figure because we do not have the rights to publish them. The original face stimuli used in the experiments are available at the Open Science Framework website for this project: https://osf.io/9g4rz. The human faces shown in this figure are similar photographs taken of lab members who gave permission to publish their identifiable images. See Supplementary Fig. 1 for all 96 visual stimuli. Full resolution versions of the stimuli used in the experiment are available at the Open Science Framework website for this project: https://osf.io/9g4rz. b Behavioral ratings for the 96 stimuli were collected by asking N = 20 observers on Amazon Mechanical Turk to “Rate how easily can you can see a face in this image” on a scale of 0–10. Illusory faces are rated as more face-like than matched nonface objects. Error bars are ±1 SEM. Source data are provided as a Source data file. c Event-related paradigm used for the fMRI (n = 16) and MEG (n = 22) neuroimaging experiments. In both experiments the 96 stimuli were presented in random order while brain activity was recorded. Due to the long temporal lag of the fMRI BOLD signal, the fMRI version of the experiment used a longer presentation time and longer interstimulus-intervals than the MEG version. To maintain alertness the participants’ task was to judge whether each image was tilted slightly to the left or right (3°) using a keypress (fMRI, mean = 92.5%, SD = 8.6%; MEG, mean = 93.2%, SD = 4.8%). d Method for leave-one-exemplar-out cross-decoding. A classifier was trained to discriminate between a given category pair (e.g., illusory faces and matched objects) by training on the brain activation patterns associated with all of the exemplars of each category except one, which was left out as the test data from a separate run for the classifier to predict the category label. This process was repeated across each cross-validation fold such that each exemplar had a turn as the left-out data. Accuracy was averaged across all cross-validation folds.

