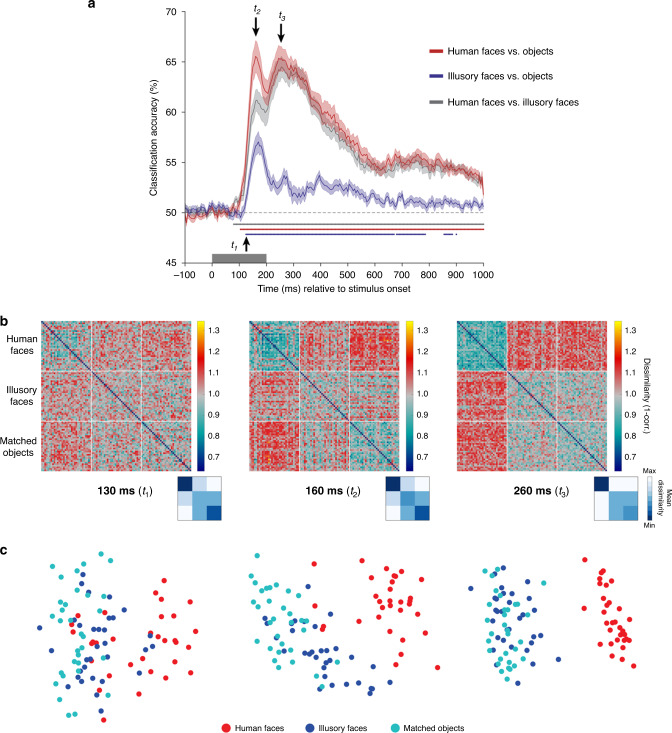
Fig. 5. MEG results showing a rapid transformation in the representation of illusory faces over time.
a Cross-decoding results across time for all three category comparisons. Mean classifier performance is plotted across time relative to stimulus onset, averaged over N = 22 participants. Shaded area represents SEM. Multiple comparisons were controlled for using Threshold-Free Cluster Enhancement as implemented in CoSMoMVPA26. Stimulus duration is indicated by the gray bar from 0–200 ms on the x-axis. Chance performance is 50%, indicated by the dashed line. Colored disks along the x-axis indicate statistically significant timepoints. By 130 ms (t1) from stimulus onset, all three comparisons can be significantly decoded. There is an initial peak at ~160 ms (t2) for all comparisons, and a second peak ~260 ms (t3) for decoding human faces from all objects with or without a face, that is absent for decoding illusory faces from matched objects. These three timepoints of interest are used as the focus for the subsequent analyses. Source data are provided as a Source data file. b Representational dissimilarly matrices (96 × 96) for all stimuli for the three timepoints of interest (130, 160, and 260 ms post stimulus onset). The dissimilarity is calculated by taking 1-correlation (Spearman) between the MEG activation patterns for each pair of stimuli. The colorbar range is scaled to the max and min of the dissimilarity values across all timepoints for visualization (see Supplementary Movie 1 for complete time-varying RDM). White lines indicate stimulus category boundaries. Insets show 3 × 3 matrices for each time point averaged by category, excluding the diagonal. Source data are provided as a Source data file. c Visualization of the dissimilarity matrices in (b) using multidimensional scaling. The first two dimensions following MDS are plotted. Each of the points representing the 96 stimuli is colored according to its category membership. Proximity of the points represents more similar brain activation patterns for the associated stimuli.

