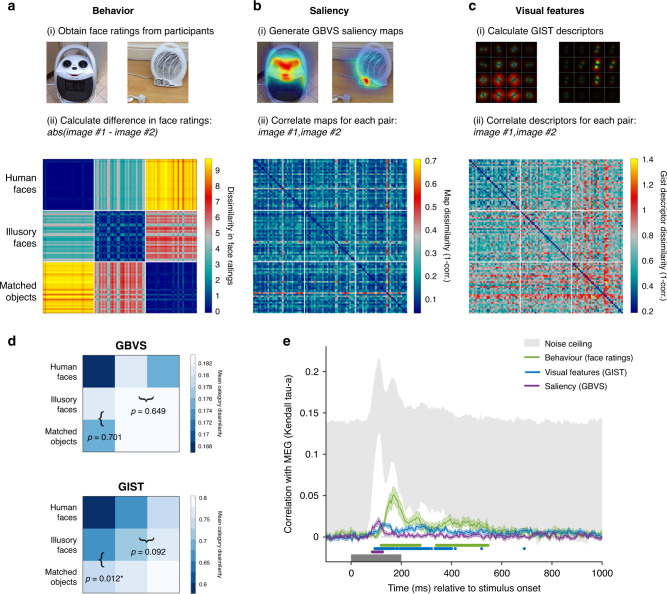
Fig. 6. Linking MEG representations to models of visual saliency, visual features, and behavior.
Construction of representational dissimilarity matrices for comparison with the MEG data for a visual saliency based on the GBVS model, b visual features based on the GIST model, and c behavior based on participants’ face ratings. Source data are provided as a Source data file. d Category-averaged RDMs were constructed for the saliency and visual feature models by averaging the mean dissimilarities for each exemplar in (a, b) respectively to produce 3 × 3 matrices. We tested (i) whether illusory faces were more similar to human faces than matched objects were and (ii) whether illusory faces were more similar to each other on average than to matched objects by subtracting the relevant squares in the category-averaged RDMs (marked with brackets). Reported p values are FDR corrected values (to control for multiple comparisons) from a two-sided permutation test (1000 permutations of the category labels of the original 96 × 96 RDM). Asterisks (*) indicate statistical significance at p < 0.05. e Correlation between the behavioral, saliency, and visual feature models in (a–c) with the time-varying MEG dissimilarity matrix. Shaded area represents SEM. The noise ceiling marked in gray represents the estimate of the maximum correlation possible given the data25. Statistically significant timepoints are indicated by colored disks along the x-axis. Multiple comparisons were controlled for using Threshold-Free Cluster Enhancement as implemented in CoSMoMVPA26. The saliency model significantly correlates with the MEG data from 85–125 ms post stimulus onset. The main significant correlation between the visual feature model and the MEG data occurs from 95–400 ms, while the behavioral model correlates in two time-windows, from 120–275 and 340–545 ms. Source data are provided as a Source data file.

