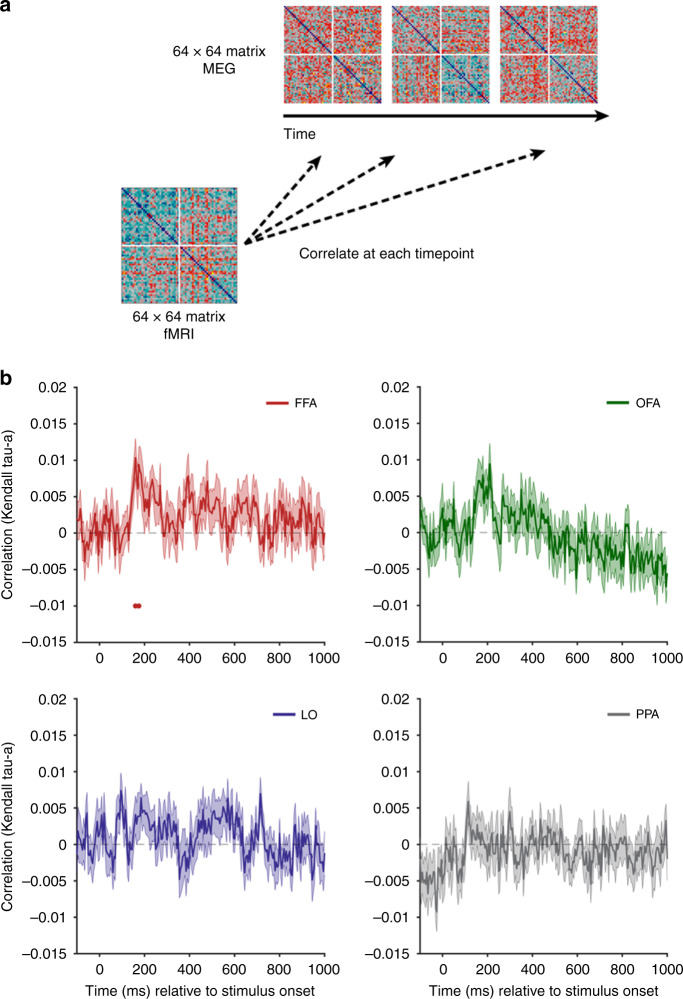
Fig. 7. fMRI-MEG fusion.
a The fMRI dissimilarity matrices (1-correlation) for each of the four ROIs were correlated with the time-varying MEG dissimilarity matrix (1-correlation). Note that real human faces (n = 32) were removed from this analysis so the matrices are 64 × 64. b Results of fMRI-MEG fusion. The mean correlation between each of the RDMs for the four ROIs with the time-varying MEG RDM is plotted relative to stimulus onset, averaged over N = 22 participants. Statistical significance is indicated by colored disks along the x-axis. Error is SEM. Source data are provided as a Source data file.

