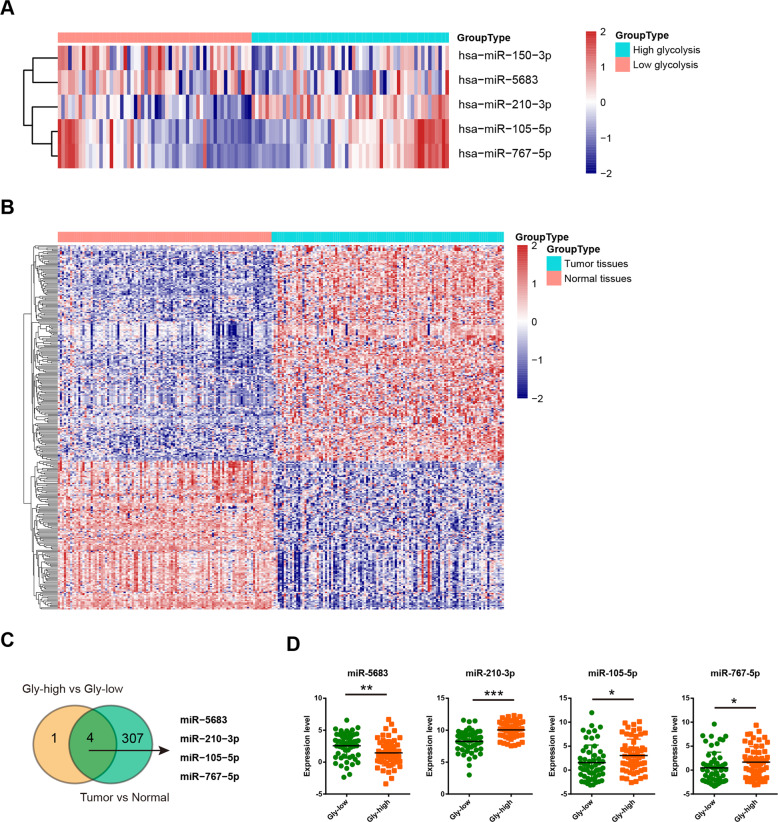
Fig. 1. Integrated analysis of key miRNAs involved in the Warburg metabolism of TNBC.
a Heatmap of 5 miRNAs related to TNBC glycolysis. b Heatmap of differentially expressed miRNAs in TNBC tumor tissues compared with matched normal tissues. c Venn diagram showed that four glycolysis-related miRNAs were upregulated or downregulated in TNBC tissues. d Expression level of miR-5683, miR-210-3p, miR-105-5p, and miR-767-5p in high glycolysis group and low glycolysis group. *p < 0.05; **p < 0.01; ***p < 0.001.

