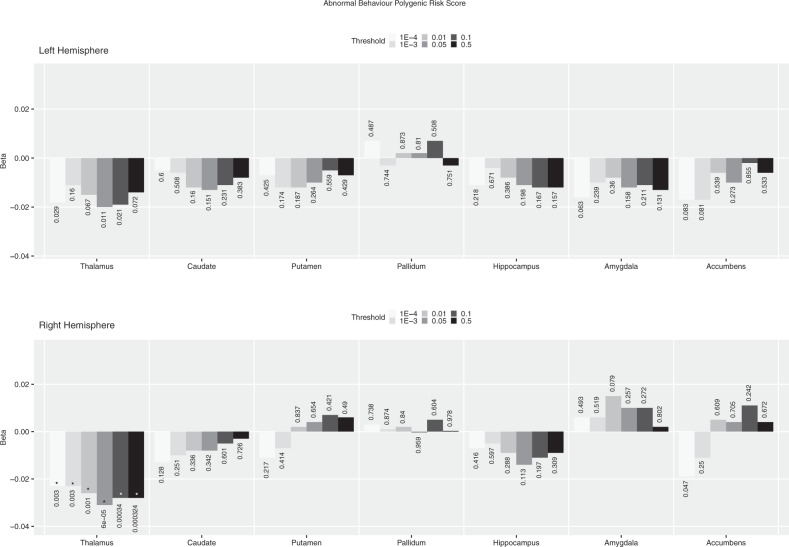
Fig. 3. Abnormal behaviour gene set PRS calculated a different p thresholds association with left and right subcortical volumes.
The direction and length of the bar correspond to the Beta value, the associated uncorrected p value is added for each Beta/bar. For comparison, this figure also includes the results for the p-threshold < 0.05 used in previous analyses. FDR correction based on 70 tests (FDR significant results are mark with an asterisk).

