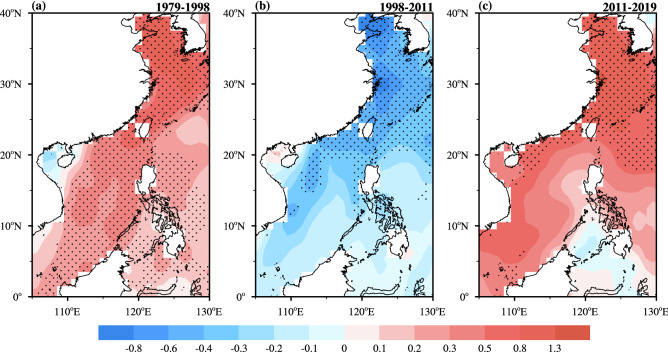
Figure 2.
Spatial patterns of the linear trends (unit: °C/decade) of the annual mean SSTAs in offshore China during (a) the warming acceleration period (1979–1998), (b) the warming slowdown period (1998–2011) and (c) the warming reacceleration period (2011–2019). Stippling denotes 10% significance according to a two-sided Student's t test. The maps in the figure are generated using the NCAR Command Language (Version 6.6.2) [Software]. (2019). Boulder, Colorado: UCAR/NCAR/CISL/TDD. 10.5065/D6WD3XH5.

