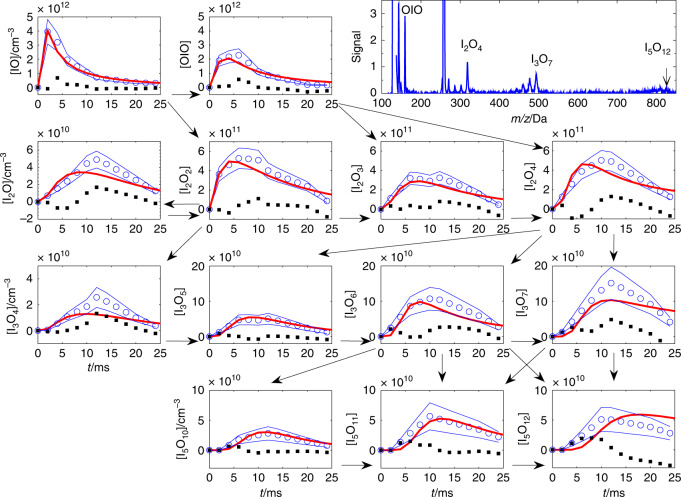
Fig. 4. IxOy kinetics.
Kinetic traces (blue circles, blue lines estimated statistical uncertainty from signal scatter) of the main peaks (blue line in the right upper panel) observed in a pulsed laser photolysis (PLP) experiment initiated by 193-nm photolysis of I2 in the presence of O3 at 9 Torr, with 10.5 eV photoionization (PI). The corresponding mass spectrum averaged for all delays is shown in the upper right corner panel. The data were recorded in the digital mode, and the PLP-PI delays were set manually in the delay generator. All traces (in concentration in cm−3 versus time in ms) have been interpolated to a constant step time axis. Note that each row shows IxOy with the same number of iodine atoms. The vertical scale is the same for all members of each row, except for the first members of the second and third rows. The red lines show the kinetic traces obtained from a numerical model (Supplementary Tables 1 and 3), and the black squares show the difference between the measurements and the model. The arrows show the main paths assumed in the chemical mechanism (Table 1).

