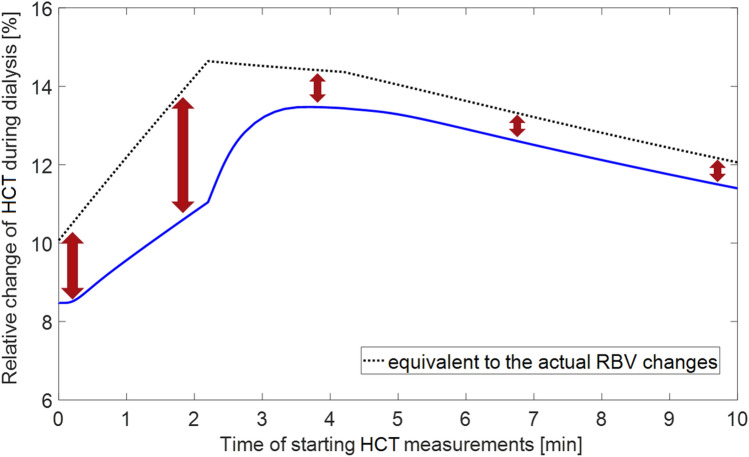
Figure 4.
Model-simulated relative change of apparent central haematocrit (HCT) induced by a 4 h haemodialysis procedure (with the priming saline infused to the patient) as a function of the time of starting the measurements with respect to the beginning of the procedure (solid line) compared with virtual HCT changes equivalent to the actual relative blood volume (RBV) changes simulated by the model from a given moment of time (dotted line).

