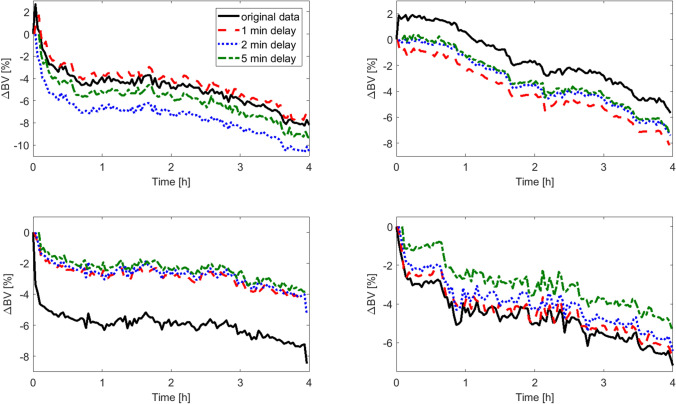
Figure 7.
Examples of relative blood volume changes (∆BV) recorded by Crit-Line system (Fresenius Medical Care AG & Co, Bad Homburg, Germany) during maintenance haemodialysis in four different patients (black solid lines) compared with the calculated ∆BV curves that would be provided by the Crit-Line system if the measurements were started with a delay of 1 min (red dashed lines), 2 min (dotted blue lines), or 5 min (green dash-dotted lines). All curves start at 0%. The data comes from patients of Medical University of Lublin, Poland.

