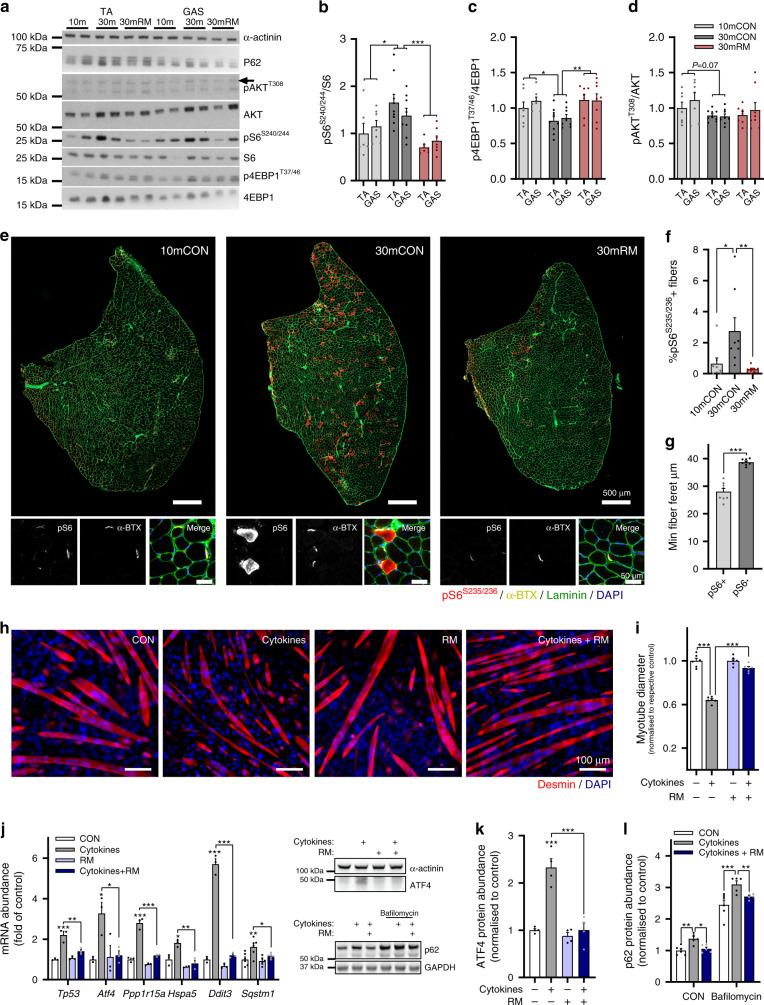
Fig. 3. Rapamycin-sensitive mTORC1 activity increases in sarcopenic muscle fibers and drives muscle wasting in vitro.
a Representative western blot analysis of AKT-mTORC1 pathway components in 10mCON, 30mCON, and 30mRM in both the tibialis anterior (TA) and gastrocnemius (GAS) muscle. Similar results were obtained for each protein across three separate gels with different samples. Quantification of western blots showing the abundance of phosphorylated protein normalized to total protein for (b) S6, (c) 4EBP1, and (d) AKT. e Representative images of TA cross sections stained for pS6S235/236 (red), α-bungarotoxin (neuromuscular junctions (NMJs), yellow), laminin (green), and DAPI (blue), and magnification of regions containing NMJs. Scale bars in full-section and enlarged images are 50 µm and 5 µm, respectively. f Quantification of the percentage of pS6S235/236-positive fibers in 10mCON, 30mCON, and 30mRM groups. g Quantification of minimum fiber Feret for pS6S235/236-positive and pS6S235/236-negative fibers in 30-month-old TA muscle. h Representative images of C2C12 myotubes incubated for 24 h in differentiation media (CON) or media containing 10 nM rapamycin, 20 ng ml−1 TNFα, and 100 ng ml−1 IFNγ (cytokines) or cytokines and rapamycin (cytokines + RM), and i quantification of myotube diameter. j RT-qPCR analysis of genes associated with ER stress and muscle wasting in C2C12 myotubes after 6 h of incubation in CON, cytokines, rapamycin, or cytokines+rapamycin. k Quantification and representative western blot image (left, upper) of ATF4 protein abundance after 6 h of incubation in differentiation media with or without cytokines and rapamycin (RM). l Quantification of p62 protein abundance and representative western blot image (left, lower) in differentiation media (CON) or media containing the autophagy-flux inhibitor bafilomycin (200 nM) after 4 h of incubation in media with or without cytokines and rapamycin (24 h). Group numbers for b are n = 6 mice for TA and seven for GAS (10mCON), eight for 30mCON, and seven for 30mRM. For c and d, n = 7 mice (10mCON), eight (30mCON), seven for TA, and eight for GAS (30RM). For f–g, n = 8. For h–i, n = 6 wells across two separate experiments. For j, n = 6 wells. For k, n = 4 wells. For l, n = 6 (CON) and five (cytokines and cytokines+RM) wells. Data are mean ± SEM. Two-way repeated-measure ANOVAs with Sidak post hoc tests (b–d, i), one-way ANOVAs with Fisher’s LSD (f), Tukey’s (j, k) post hoc tests, or student’s two-sided t test (g), were used to compare between data. *, **, and *** denote a significant difference between groups of P < 0.05, P < 0.01, and P < 0.001, respectively. Where 0.05 < P < 0.1, P values are reported.

