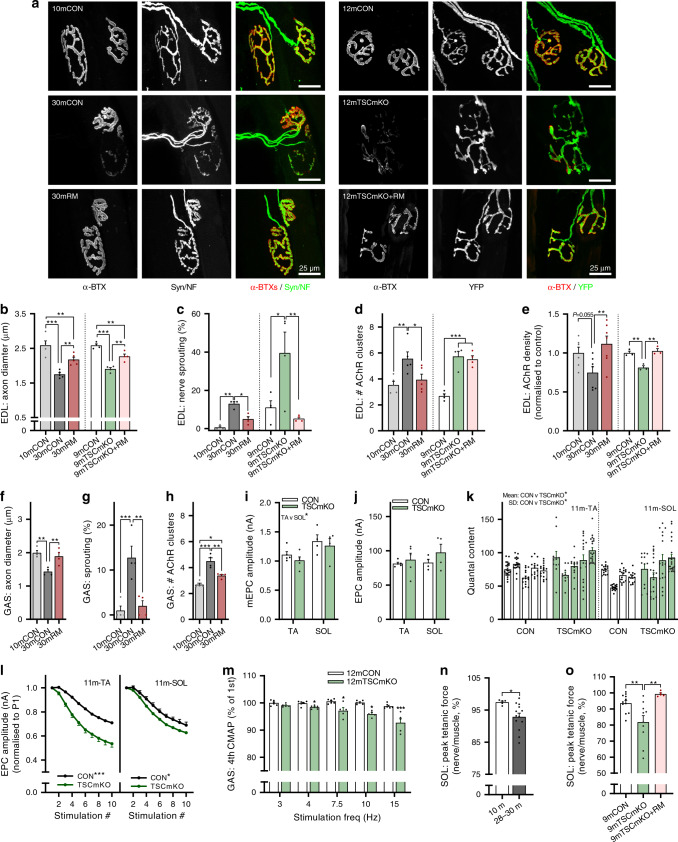
Fig. 4. Overactive mTORC1 drives neuromuscular junction (NMJ) instability and impairs NMJ function.
a Representative whole-mount images of the pre- (neurofilament/synaptophysin or YFP) and postsynapse (acetylcholine receptors (AChRs) stained using alpha bungarotoxin) in extensor digitorum longus (EDL) muscle for 10-month-old control (10mCON), 30-month-old (30mCON), and 30-month-old mice treated from 15 months with rapamycin (30mRM, left) and for 9-month-old control (9mCON), TSCmKO (9mTSCmKO), and TSCmKO + 4 weeks of rapamycin-treatment (TSCmKO+RM, right) mice. Morphological properties of whole-mount EDL NMJs, including b axon diameter, c the percentage of NMJs with sprouting axons, and d the number of postsynaptic AChR clusters for 9mTSCmKO and sarcopenic experiments. e Acetylcholine receptor density in EDL cross sections. f–h Morphological properties of whole-mount GAS NMJs for 10mCON, 30mCON, and 30mRM mice. In situ electrophysiological readouts of individual NMJ transmission properties in the tibialis anterior (TA) and soleus (SOL) muscle of 11-month-old TSCmKO mice and littermate controls, including (i) miniature end- plate current (mEPC), j end-plate current (EPC), k quantal content, and l EPC over repeated stimulations. m EMG recordings of compound muscle action potential (CMAP) rundown over four consecutive stimulations in the GAS of 9-month-old TSCmKO mice and littermate controls at stimulation frequencies between 3 and 15 Hz. Nerve- relative to muscle-stimulated peak tetanic force in SOL nerve-muscle preparations in (n) 10- (n = 5) and 28–30-month-old (n = 13) wild-type mice, and (o) 9-month-old control (n = 11), TSCmKO (n = 10), and TSCmKO mice treated with rapamycin for 4 weeks (n = 5). Group numbers for 10mCON are n = 5 (b, d), 3 (c), 6 (e), and 4 (f–h) mice. For 30mCON and 30mRM, n = 5 (b, d), 4 (c, f–h), and 7 (e) mice. For 9mCON, 9mTSCmKO, and 9mTSCmKO+RM, n = 4 (b–d) and 3 (e) mice. For 11mCON and 11mTSCmKO, n = 5 (TA: i–l) and 4 (SOL: i–l) mice. For m, n = 6 (12mCON) and 5 (12mTSCmKO) mice. For n, n = 5 (10m) and 13 (28–30 m). For o, n = 11 (9mCON), 10 (9mTSCmKO), and 5 (9mTSCmKO + RM) mice. Data are presented as mean ± SEM. One-way ANOVA with Fisher’s LSD post hoc test (b–h, o), two-way (i–j) or two-way repeated-measure ANOVA (l, m) with Fisher’s LSD post hoc test (m), or two-tailed independent student’s t test (n) were used to compare between data. *, **, and *** denote a significant difference between groups of P < 0.05, P < 0.01, and P < 0.001, respectively. Where 0.05 < P < 0.1, P values are reported.

