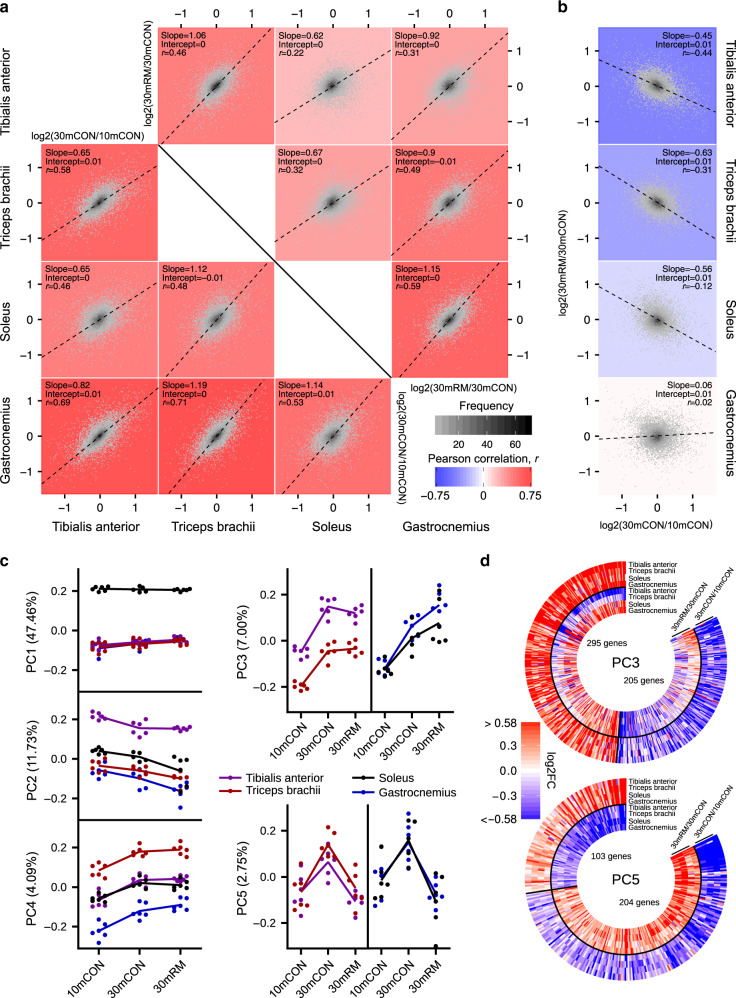
Fig. 5. Rapamycin exerts pro- and anti-aging stimuli.
a Pairwise comparisons of age- (30mCON/10mCON, under diagonal) and rapamycin-induced (30mRM/30mCON, above diagonal) gene expression changes between tibialis anterior (TA), triceps brachii (TRI), soleus (SOL), and gastrocnemius (GAS) muscles, and b pairwise comparisons of age- and rapamycin-induced gene expression changes within muscles with slope, intercept, and Pearson’s correlation coefficient (r) indicated. For a and b, each graph is a 2D-density plot with the plotting area divided into small fragments; the intensity of the gray color of each fragment represents the number of genes in that fragment. Black dashed lines correspond to directions of the highest variance (PC1) for comparisons with the slope “s” and intercept “i”. The color of the plotting area was defined by the strength of the Pearson correlation coefficient r. c Coordinates of principal components (PC1–5) for gene expression data collected in TA, TRI, SOL, and GAS in 10mCON, 30mCON, and 30mRM. n = 6 mice per group and muscle, except for SOL 30mCON where n = 5. Each dot corresponds to one muscle sample, from an individual animal. The numbers associated with the PCs indicate the fraction of the variance in transcript expression in samples along the corresponding PC. d Heatmaps of the changes in the expression of genes aligned with PCs 3 and 5, respectively. A gene was considered aligned with a PC if the absolute value of the Pearson correlation between the expression of the gene and PC coordinates was ≥0.4, and the absolute value of the z score of the projection of the gene expression on a PC was ≥1.96.

