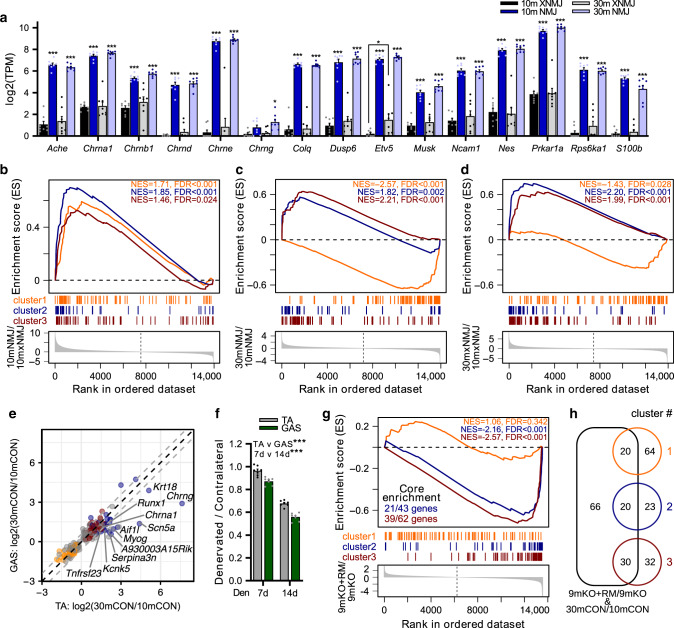
Fig. 7. The neuromuscular junction (NMJ) is a focal point of mTORC1-driven sarcopenic signaling.
a The expression of genes known to be enriched at the NMJ based on mRNA-seq data generated from synaptic (NMJ) and extra-synaptic (xNMJ) regions of TA muscle from 10-month-old (10m) and 30-month-old (30m) mice. NMJ and xNMJ samples were collected using laser-capture microdissection on α-bungarotoxin- stained cross sections. Gene set enrichment analysis (GSEA) comparing the expression of genes in (b) NMJ versus xNMJ regions of 10m mice. c NMJ regions of 30m versus 10m groups and d xNMJ regions of 30m versus 10m groups. The distribution of genes from clusters 1, 2, and 3 was examined in lists of genes ranked by the magnitude of changes between conditions. Significance was set at the false discovery rate (FDR) < 0.01. e Scatterplot of fold-change expression of genes aligned with the aging PC3 from Fig. 6a between 30m and 10m for gastrocnemius (GAS) and tibialis anterior (TA). Labeled genes show a > log2(1.5)-fold change between TA and all three other muscles. Genes from clusters 1, 2, and 3 are colored orange, red, and blue, respectively, while gray dots are genes aligned with aging PC3, but not belonging to clusters 1–3. f Muscle mass of TA and GAS muscles denervated for 7 or 14 days relative to the contralateral control leg. g GSEA comparing the distribution of genes from clusters 1–3 in the ranked list of gene expression changes between 9-month-old TSCmKO mice (9mKO) and 9-month-old TSCmKO mice subjected to 3 days of rapamycin (8 mg kg−1 day−1) treatment (9mKO+RM). For clusters significantly enriched, the number of genes reaching the “leading edge” threshold are indicated. h Venn diagram of genes differentially expressed between 9mKO+RM and 9mKO, and aligned with the aging PC3, and their overlap with genes in clusters 1–3. Group numbers are (a–d) 8, (e) 6, (f) 7, and (g) 5. For (e), each dot represents the log-fold change between means of mice in each group. Data are means ± SEM. Two-way ANOVAs (a, f) with Tukey’s post hoc test (a) were used to compare between data. *, **, and *** denote a significant difference between groups of P < 0.05, P < 0.01, and P < 0.001, respectively.

