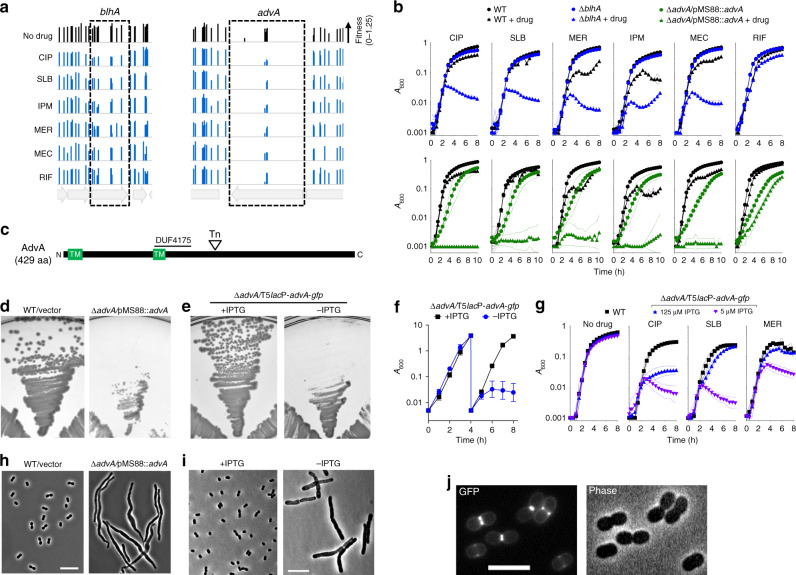
Fig. 3. AdvA is a critical cell division protein connected by susceptibility phenotypes to BlhA.
a A. baumannii transposon mutants mapping throughout blhA and in a limited region of advA show decreased fitness with fluoroquinolones and β-lactams but not RIF. Bars show Tn-seq fitness values of individual Tn10 mutants at each locus across all tested banks in the indicated condition. b Validation of Tn-seq drug susceptibility phenotypes using defined mutants independently cultured in microplates. EGA746 (∆blhA, top, blue symbols) or EGA745 (∆advA/pMS88::advA, bottom, green symbols) were tested in parallel with the same WT control (black symbols). Data are presented as geometric mean (indicated by symbols) ±s.d. (indicated by area-filled dotted bands) from n = 3 independent cultures. Where not visible, s.d. is within the confines of the symbol. c Schematic of AdvA protein. Tn indicates approximate location of transposons in advA analyzed by Tn-seq, TM indicates predicted transmembrane helix. d, e AdvA is essential for colony formation. EGA745 or control were grown on solid medium at 37 °C (d). AFA11 (∆advA harboring T5lacP-advA-gfp) was grown on solid medium ± 0.5 mM IPTG (e). Images are representative of 18 (d) or 3 (e) parallel cultures. f AdvA is essential for growth in broth. AFA11 pregrown with 1 mM IPTG was diluted into LB ± 1 mM IPTG, followed by dilution into the same medium after 4 h. Growth was monitored by A600 (1-cm cuvettes). Data points show geometric mean ± s.d. (n = 3 independent cultures). g AdvA level determines antibiotic susceptibility. AFA11 pregrown with 250 µM IPTG was washed, resuspended in LB with 5 or 125 µM IPTG, and cultured with WT control in microplates with or without the indicated sub-MIC antibiotic (Supplementary Table 1). Data are shown as geometric mean ± s.d. as in (b). h, i advA deficiency results in cell filamentation. The indicated strains grown with or without inducer were imaged via phase-contrast. Images are representative of three parallel cultures. Scale bar, 10 µm. j AdvA-GFP localizes to mid-cell at sites of cell division. WT A. baumannii harboring T5lacP-advA-gfp was cultured to mid-log phase with 50 µM IPTG and imaged by phase-contrast and fluorescence microscopy. Scale bar, 5 µm. Images are representative of two parallel cultures. Source data are provided as a Source Data file.

