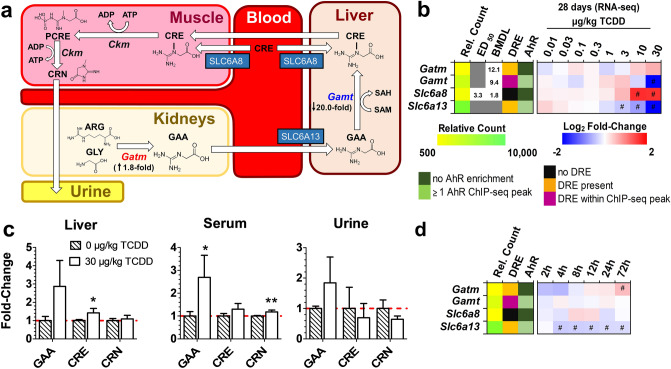
Figure 4.
TCDD-Elicited Dose-Dependent Effects on Creatine Biosynthesis. (a) Schematic of systemic creatine biosynthesis and transport. For 30 µg/kg TCDD treatment groups, renal Gatm expression and hepatic Gamt fold-changes from vehicle are denoted. (b) Hepatic gene expression associated with creatine metabolism at 8 or 28 days repeated TCDD exposure. (c) Guanidinoacetate (GAA)-, creatine (CRE)-, and creatinine (CRN)-fold changes determined by LC–MS/MS in male mice orally gavaged with sesame oil vehicle or 30 µg/kg TCDD every 4 days for 28 days (mean ± s.e.m., n = 5). (d) Hepatic expression associated with creatine metabolism in male mice orally gavaged with a bolus dose of 30 µg/kg TCDD (n = 8). For the heatmaps, the effective dose (ED50), benchmark dose lower limit (BMDL), and relative transcript count (Rel. Count) are denoted. The red/blue color scale represents the log2(fold change) for differential gene expression. Orange represents the presence of putative dioxin response elements (pDREs) with a matrix similarity scores (MSS) ≥ 0.856. AhR enrichment peaks (FDR ≤ 0.05) denoted by light green were determined by ChIP-seq. pDREs found within AHR ChIP-seq enrichment peaks are denoted by garnet. Asterisks denote (*) p < 0.05 or (**) p < 0.01 determined by one-way ANOVA with a Dunnett’s post-hoc test. Pound signs (#) denote posterior probabilities P1(t) ≥ 0.80 compared to vehicle. Official gene name and symbol, and metabolite abbreviations: Gamt guanidinoacetate N-methyltransferase, Gatm glycine amidinotransferase, mitochondrial, Ckm creatine kinase M-type, ARG arginine, GLY glycine, GAA guanidinoacetate, CRE creatine, and CRN creatinine, PCRE phosphocreatine.

