Figure 2.
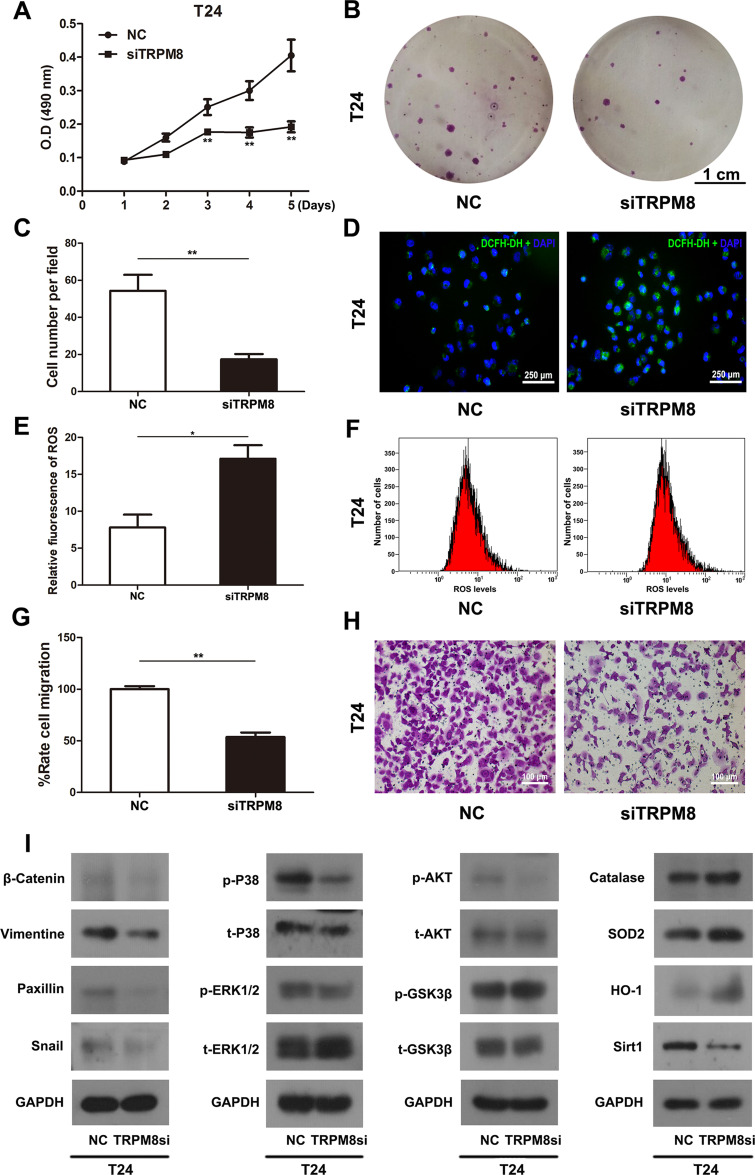
Effect of TRPM8 on BCa T24 cells. (A) The cell viability was analyzed by MTT assay using T24 cells treated by TRPM8 target-specific-siRNA (siTRPM8) and negative-control-siRNA (NC). (B) Clonogenic survival assay was performed to measure the proliferation of T24 cells after siRNA transfection for 48 h and culture in 6-well plates for 15 days. The scale bar represents 1 cm. (C) The cell number per field in the clonogenic survival assay was counted and statistically analyzed. (D) Representative images of DCFH-DA staining of ROS (green) in T24 cells transfection with siRNA. Nuclei were stained with DAPI (blue). The scale bar represents 250 μm. (E) Statistical analysis of the relative fluorescence of ROS in T24 cells after the siRNA transfection. (F) The ROS level was detected in T24 cells after siRNA transfection using flow cytometry. (G) Statistical analysis of the results of the transwell migration assay. (H) Transwell migration assay was performed to measure the migration of T24 cells after siRNA transfection. The scale bar represents 100 μm. (I) Western blot analyses of the levels of proteins involved in cell viability, ROS metabolism and migration. GAPDH served as a loading control. All values are presented the mean ± SD of triplicate measurements, and the experiments were repeated three times with similar results, *p<0.05, **p<0.01.

