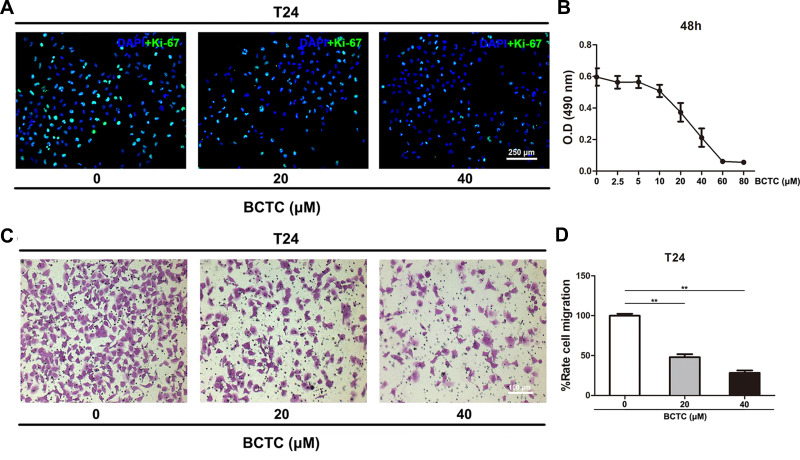
Figure 3.
BCTC reduces the viability and migration of T24 cells. (A) Immunofluorescence staining of Ki-67 (green) in T24 cells treated with 0, 20 or 40 μM BCTC for 48 h. Nuclei were stained by DAPI (blue). The scale bar represents 250 μm. (B) The viability of T24 cells treated with different concentrations of BCTC (0, 2.5, 5, 10, 20, 40, 60 or 80 μM) for 48 h was evaluated using the MTT assay. (C) Transwell migration assay was performed to measure the migration of T24 cells that had been pretreated with 0, 20 or 40 μM BCTC for 48 h. The scale bar represents 100 μm. (D) The relative cell migration rate was calculated and a statistical analysis was performed. All values are presented as the mean ± SD of triplicate measurements and the experiments were repeated three times with similar results, **p<0.01.

