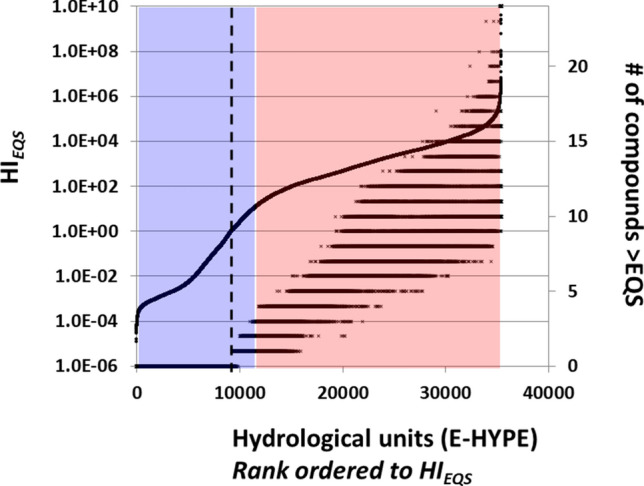
Figure 2.

Evaluation of Europe’s surface water quality based on predicted environmental concentrations for 24 priority substances (PS) using a quantitative mixture pollution pressure metric, HIEQS. X-axis: E-HYPE hydrological units separately rank-ordered based on hazard indices (HIEQS, 1st Y-axis) and # of compounds (2nd Y-axis). 1st Y-axis: HIEQS. 2nd Y-axis: number of compounds contributing to the HI with an RQ > 1, plotted following the rank order of the pollution pressure described by HIEQS (X-axis). Water bodies with similar HIEQS or adjacent ranks can have different numbers of compounds that exceed their EQS. The transparent blue and red boxes are identical as in Fig. 1. Water bodies to the right of the dotted line are interpreted to be insufficiently protected against mixtures. RQ Risk Quotient, HI Hazard Index, EQS Ecological Quality Standard. Outcomes based on the means of a year’s predicted environmental concentrations (mean-PEC), related to the approach used to characterize chemical pollution in the WFD, for 35,406 hydrological units, as Fig. 1.
